
As a startup, Chainlink solves a significant obstacle that concerns transferring data between blockchains and the real world.
The protocol, whose origins date back to September 2014 – a period when half of the world have not even heard about blockchains and Bitcoin, offered a solution that enables independent data sources to feed information into public ledgers through a decentralized oracle network.
Flash forward to 2020, Chainlink is now part of 315 blockchain projects, including decentralized finance protocols, data providers, blockchain nodes, and whatnot.
#Chainlink ecosystem growth never slows with 29 new October integrations ?
Total $LINK integrations 315 – including:
74 #blockchains
98 #DeFi
23 #data providers
44 nodes and more!View all here: https://t.co/ZUaUvFgUSd
Is your #smartcontract #PoweredByChainlink
It should! pic.twitter.com/IdCX65zNYa
— TheLinkMarine ? (@TheLinkMarine1) November 1, 2020
Chainlink’s success is also visible in its market capitalization, which has surged to $4.275 billion from $101 million in just two years. Naturally, the upswing has also pushed the price of LINK, Chainlink’s in-house token, higher; it was recently up by more than 17,000 percent since launch.
But despite Chainlink’s growth as an oracle protocol, the performance of its token remains exposed to the supply-and-demand dynamics. The LINK/USD exchange rate topped at $20.71 in August 2020. The pair later experienced a significant sell-off. The move brought its price down by as much as 64 percent – as of September 23.
LINK’s plunge was a product of a bearish technical setup. As usual, the token bounced back, logging a 79.18 percent recovery. Nevertheless, it remained under bearish pressure as a combination of technical and fundamental signals pointed to an extended downside bias among traders.
Here are three reasons why LINK has more room to fall in the coming sessions.
#1 New Addresses
The first bearish setup for LINK arises from its address count.
Data fetched by IntoTheBlock shows that the number of new LINK addresses has barely moved in the last 30 days. The Chainlink network is currently adding an average of 2,000 addresses every day. At its best in August, the project was integrating about 10,000 a day.
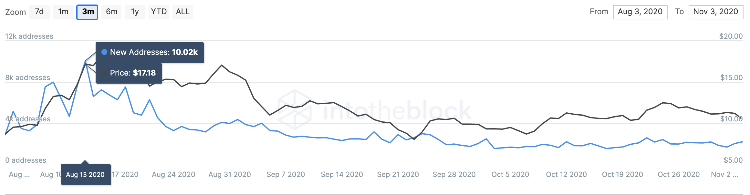
Chainlink's new addresses are declining. Source: IntoTheBlock
That shows an 80 percent decline. Meanwhile, IntoTheBlock further reported that over 800 LINK whales with balances between 1,000 to 10,000 LINK left the Chainlink network ahead of the October close. That also shows that serious traders are selling their LINK holdings.
#2 Bitcoin Dominance
Chainlink’s solid long-term fundamentals have also fallen prey to a growing Bitcoin dominance in the overall cryptocurrency market amid the US presidential election.
More and more traders have reallocated their capital into Bitcoin, believing the cryptocurrency would be at the forefront of the winners that will benefit from the second coronavirus stimulus package. The bill reached an impasse in the US Congress after the Democrats and the Republicans entered negotiations over its size.
Bitcoin bulls believe that a clear win for the Democratic candidate Joe Biden would have him prove the majority in the Senate. The Democrats want a big relief fund for Americans. So their elevation into the Senate House would mean more dollar liquidity for the US economy.

Bitcoin touched its three-year high this week on "blue sweep" hopes. Source: BTCUSD on TradingView.com
As a result, the greenback’s purchasing power will dip and, in turn, would send the Bitcoin prices higher.
Therefore, traders believe it is wiser to keep their funds locked in the Bitcoin market. That has hurt LINK in the short-term.
#3 LINK Bear Flag and 30% Price Correction
With two concretely bearish fundamentals lurking over LINK, a technical setup is further validating the downside outlook for the token. It has to do with a “Bear Flag.”

LINK bearish setup. Source: LINKUSD on TradingView.com
The bearish continuation pattern typically surfaces during a downtrend. It looks like an upward channel after a strong move downside but eventually breaks below the lower trendline to continue heading lower. The ideal bearish target here is as lower as the height of the pole (downward arrow in the chart above).
Nevertheless, LINK has adequate support levels even if it breaks below the Bear Flag pattern. The first of such price floors is at $7.15, almost 30 percent lower. The second one is at $4.90, down 50 percent from the current levels.
If the fundamentals above persist, then the LINK/USD pair could test $7.15 for a rebound.