
Binance coin price is up over 5% and it is outperforming bitcoin against the USDT. BNB could rally further to a new monthly high if it breaks the $24.00 resistance zone.
- Binance coin price is gaining bullish momentum above the $22.80 resistance against the USDT.
- The price is approaching a key resistance near the $23.75 and $24.00 resistance levels.
- There is a crucial bearish trend line forming with resistance near $23.80 on the 4-hours chart of the BNB/USDT pair (data source from Binance).
- Bitcoin price is still struggling to recover and it remains at a risk of a sharp decline.
Binance Coin Price Showing Positive Signs
In the past few sessions, bitcoin and Ethereum struggled to recover, while binance coin started a fresh increase. BNB price broke the $22.00 resistance and remained stable above the $21.50 support zone.
There was a close above the $21.80 level, the 100 simple moving average (4-hours), and the 50% Fib retracement level of the downward move from the $25.57 high to $18.03 low. BNB is now trading above the $23.00 level, with a positive angle.
At the outset, the price is approaching a key resistance near the $23.75 and $24.00 resistance levels. There is also a crucial bearish trend line forming with resistance near $23.80 on the 4-hours chart of the BNB/USDT pair.
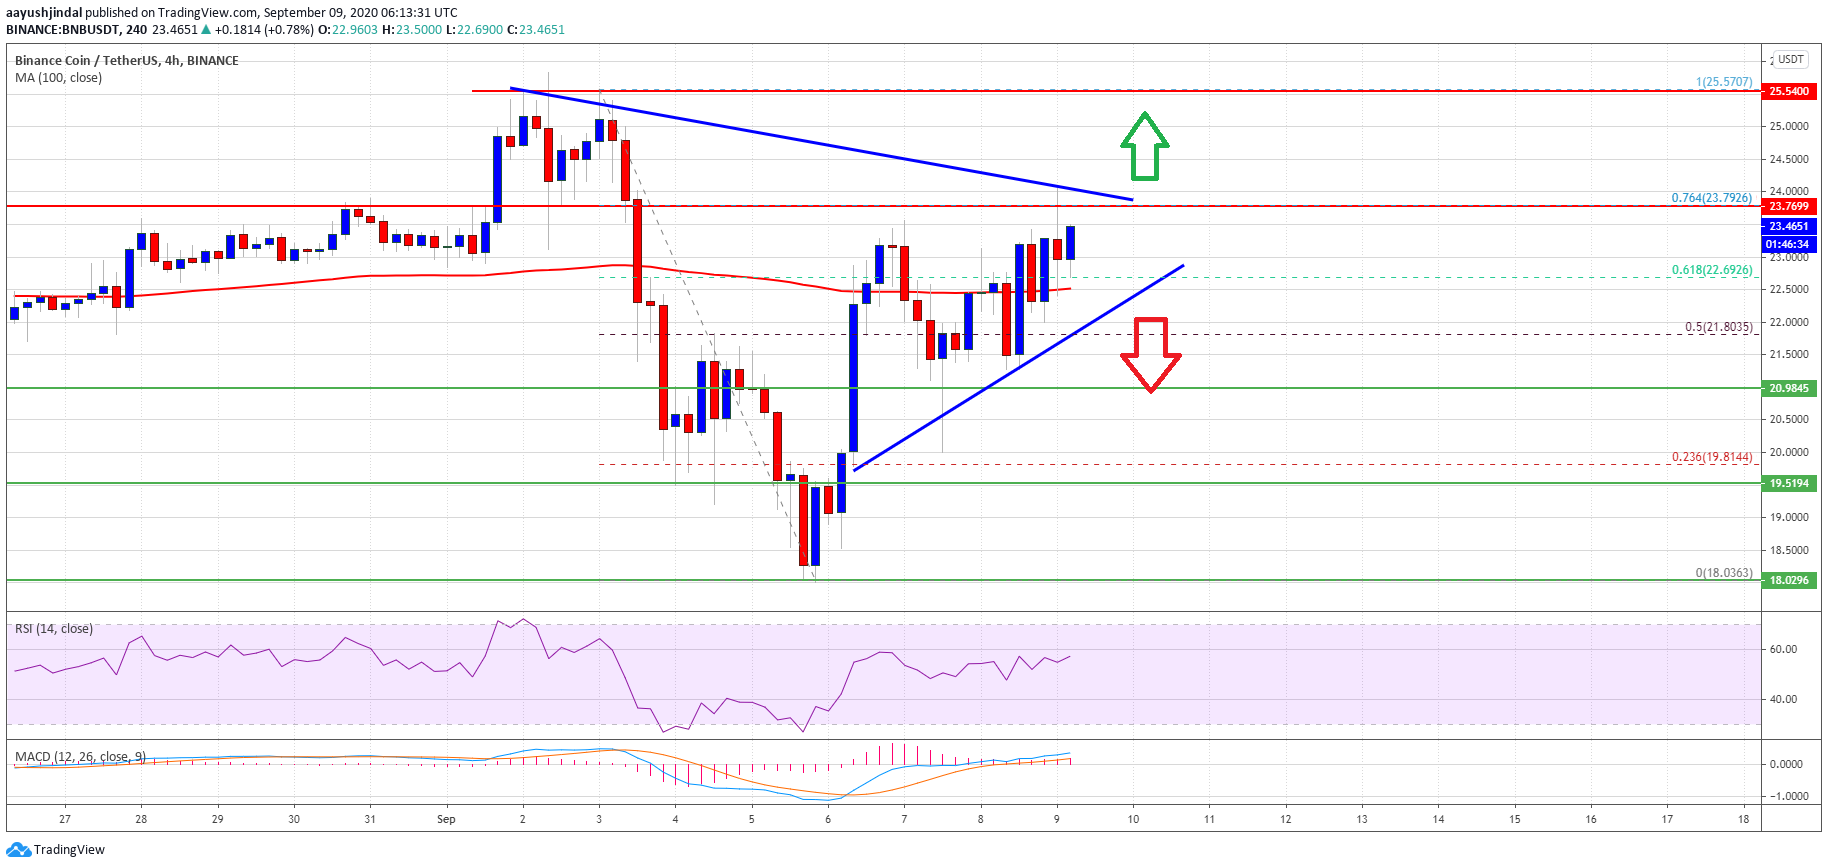
Binance coin price trades above $23.00. Source: TradingView.com
The trend line is close to the 76.4% Fib retracement level of the downward move from the $25.57 high to $18.03 low. A clear break above the trend line resistance and the $24.00 barrier could start a strong increase in the coming sessions.
The next major resistance is near the $25.00 level, above which the price is likely to attempt a fresh multi-week high above the $25.60 resistance zone.
Dips Supported in BNB
If BNB fails to clear the $23.75 and $24.00 resistance levels, it could start a downside correction. An initial support is near the $22.65 level and a connecting bullish trend line.
The first major support is near the $22.50 level and the 100 simple moving average (4-hours), below which the bulls are likely to lose control. In the stated case, the price might slide back towards the $21.00 and $20.80 support levels.
Technical Indicators
4-Hours MACD – The MACD for BNB/USDT is gaining momentum in the bullish zone.
4-Hours RSI (Relative Strength Index) – The RSI for BNB/USDT is currently well above the 50 level.
Major Support Levels – $22.60, $22.50 and $21.00.
Major Resistance Levels – $23.75, $24.00 and $25.00.