
Bitcoin price started a decent recovery wave above the $10,200 resistance against the US Dollar. BTC is still struggling near $10,500, but dips are likely to remain supported near $10,200.
- Bitcoin is currently correcting lower from the $10,500 resistance zone.
- It is trading below the 100 hourly simple moving average and approaching the $10,200 support.
- There is a connecting bullish trend line forming with support near $10,240 on the hourly chart of the BTC/USD pair (data feed from Kraken).
- The pair is likely to find a strong buying interest near the $10,200 and $10,150 levels.
Bitcoin Price Approaching Key Supports
Yesterday, we saw a decent recovery wave in bitcoin price above the $10,200 resistance against the US Dollar. BTC even broke the 100 hourly simple moving average and spiked above the $10,400 resistance.
However, the bulls failed to gain strength and the price remained below the $10,500 resistance. A high is formed near $10,492 and the price is currently correcting lower. There was a break below the $10,350 and $10,300 levels.
Bitcoin is now trading below the 23.6% Fib retracement level of the recent recovery wave from the $9,855 swing low to $10,492 high. The first major support on the downside is near the $10,250 level. There is also a connecting bullish trend line forming with support near $10,240 on the hourly chart of the BTC/USD pair.
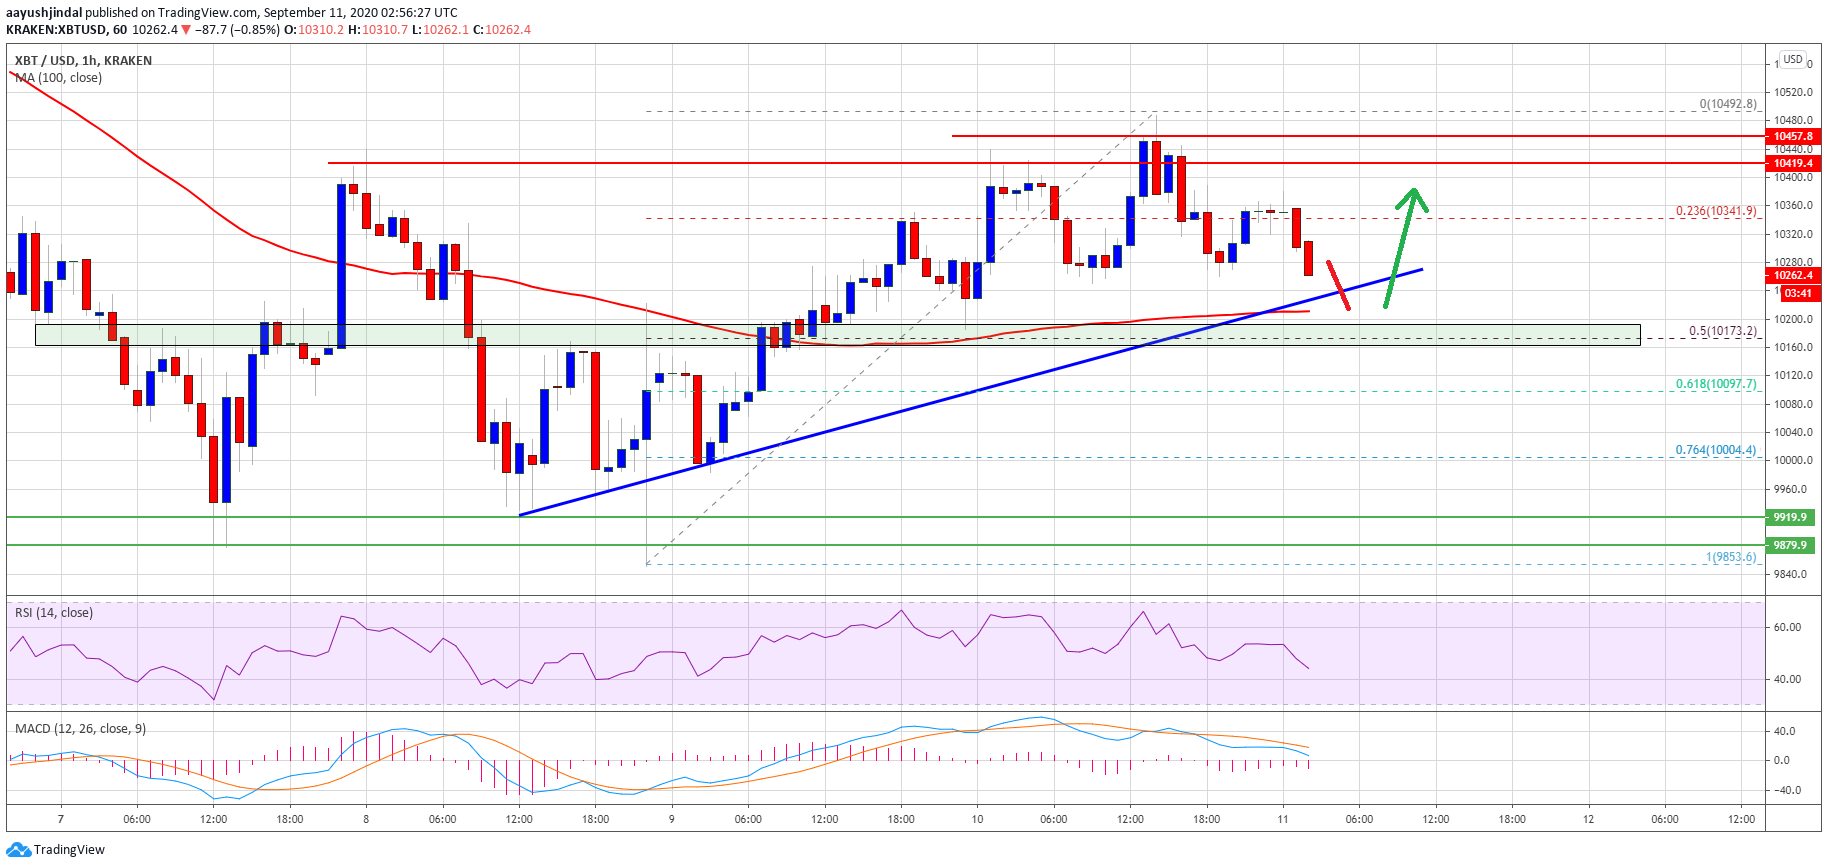
Bitcoin price trades below $10,400. Source: TradingView.com
The next major support is near the $10,200 level and the 100 hourly SMA. On the upside, the price is facing a strong resistance near the $10,400 and $10,500 levels.
A successful close above the $10,500 resistance level is must for upside continuation. The next major resistance is near $10,600, above which the price is likely to rise towards the key $11,000 hurdle.
More Losses in BTC?
If bitcoin fails to stay above the $10,200 support and the 100 hourly SMA, there is a risk of more losses. The next major support is near the $10,160 level (the previous breakout zone).
A close below the $10,160 and $10,150 levels may perhaps increase chances of another breakdown. In the stated case, the price could even revisit the $9,850 support level. A daily close below the $9,850 level is likely to push the price towards $9,500.
Technical indicators:
Hourly MACD – The MACD is slowly gaining pace in the bearish zone.
Hourly RSI (Relative Strength Index) – The RSI for BTC/USD is currently well below the 50 level.
Major Support Levels – $10,200, followed by $10,150.
Major Resistance Levels – $10,400, $10,500 and $10,600.