
Bitcoin price rallied more than 5%% and it even broke the $13,000 resistance against the US Dollar. BTC is now correcting gains, but there are key supports near $12,500.
- Bitcoin gained bullish momentum and it rallied above the $12,500 and $13,000 resistance levels.
- The price traded to a new monthly high at $13,243 and it is well above the 100 hourly simple moving average.
- There is a key bullish trend line forming with support near $12,650 on the hourly chart of the BTC/USD pair (data feed from Kraken).
- The pair is likely to resume its upward move as long as it is above $12,650 and $12,500.
Bitcoin Price Rallies Above $13K
Bitcoin price extended its rise and broke many hurdles near the $12,500 level. BTC even surged above the $13,000 resistance level and settled well above the 100 hourly simple moving average.
A new monthly high is formed near the $13,243 level before the price started a sharp downside correction. It declined more than $500 and broke the $13,000 level. There was also a break below the 23.6% Fib retracement level of the recent rally from the $12,155 low to $13,243 high.
However, the price is holding a couple of important support near $12,700 and $12,650. There is also a key bullish trend line forming with support near $12,650 on the hourly chart of the BTC/USD pair.
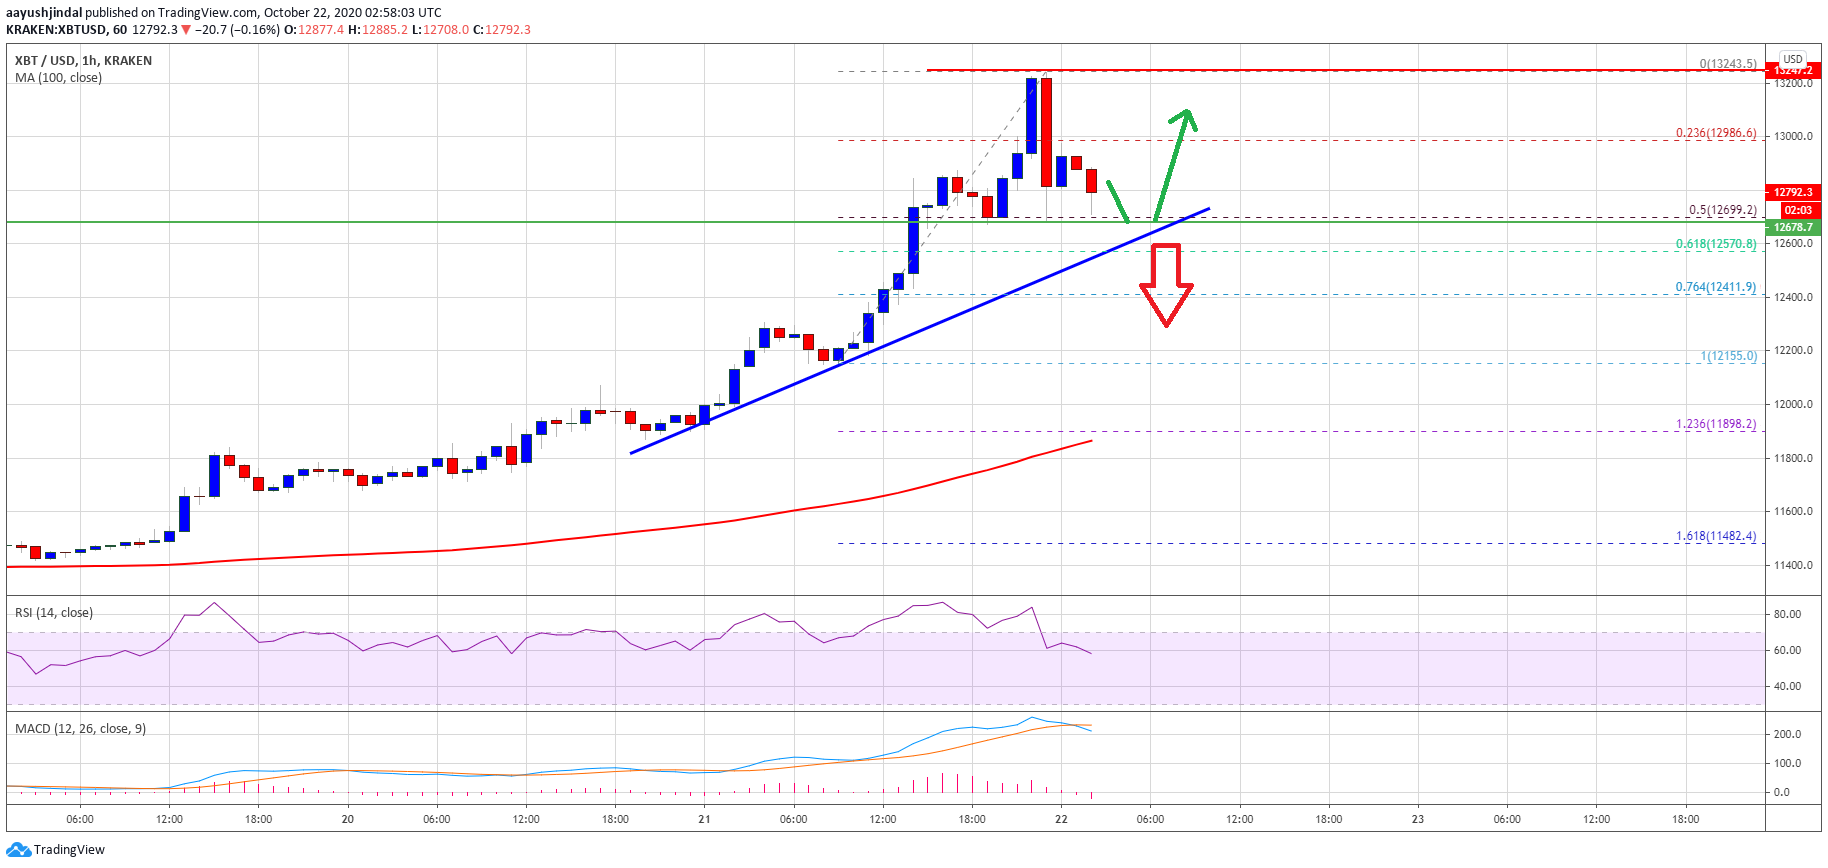
Source: BTCUSD on TradingView.com
The trend line is close to the 50% Fib retracement level of the recent rally from the $12,155 low to $13,243 high. If bitcoin stays above the trend line support, it is likely to resume its upward move above the $12,850 and $13,000 levels.
The next key resistance is near the $13,250 level. A clear break above the recent high and $13,250 could open the doors for a test of the $13,650 zone in the coming sessions.
More Downsides in BTC?
If bitcoin fails to stay above the trend line support and $12,650, it could extend its downside correction. The next major support is near the $12,500 level.
Any further losses could start a larger degree downside correction may be towards the $12,000 support or the 100 hourly simple moving average.
Technical indicators:
Hourly MACD – The MACD is slowly losing momentum in the bearish zone.
Hourly RSI (Relative Strength Index) – The RSI for BTC/USD is still well above the 50 level, with a minor bearish angle.
Major Support Levels – $12,650, followed by $12,500.
Major Resistance Levels – $12,850, $13,000 and $13,250.