
Bitcoin price rallied over 10% and it even traded close to $16,000 against the US Dollar. BTC is currently correcting lower, but the bulls are likely to protect $15,300 or $15,150.
- Bitcoin started a strong rally and it broke the $15,500 resistance zone.
- The price traded to a new 2020 high at $15,974 and it is well above the 100 hourly simple moving average.
- There is a major bullish trend line forming with support near $15,300 on the hourly chart of the BTC/USD pair (data feed from Kraken).
- The pair could correct lower, but the $15,300 and $15,200 levels are likely to prevent heavy losses.
Bitcoin Price Rallies Close to $16K
There was a strong upward move in bitcoin price after it settled above the $14,000 resistance. BTC surged more than 10% and it broke many hurdles near $15,000. There was also a close above the $15,500 level and the 100 hourly simple moving average.
The price traded to a new 2020 high at $15,974 and it is currently correcting lower. There was a break below the $15,800 level, plus the price traded below the 23.6% Fib retracement level of the recent rally from the $14,657 swing low to $15,974 high.
On the downside, there are many important supports near $15,400 and $15,300. There is also a major bullish trend line forming with support near $15,300 on the hourly chart of the BTC/USD pair.
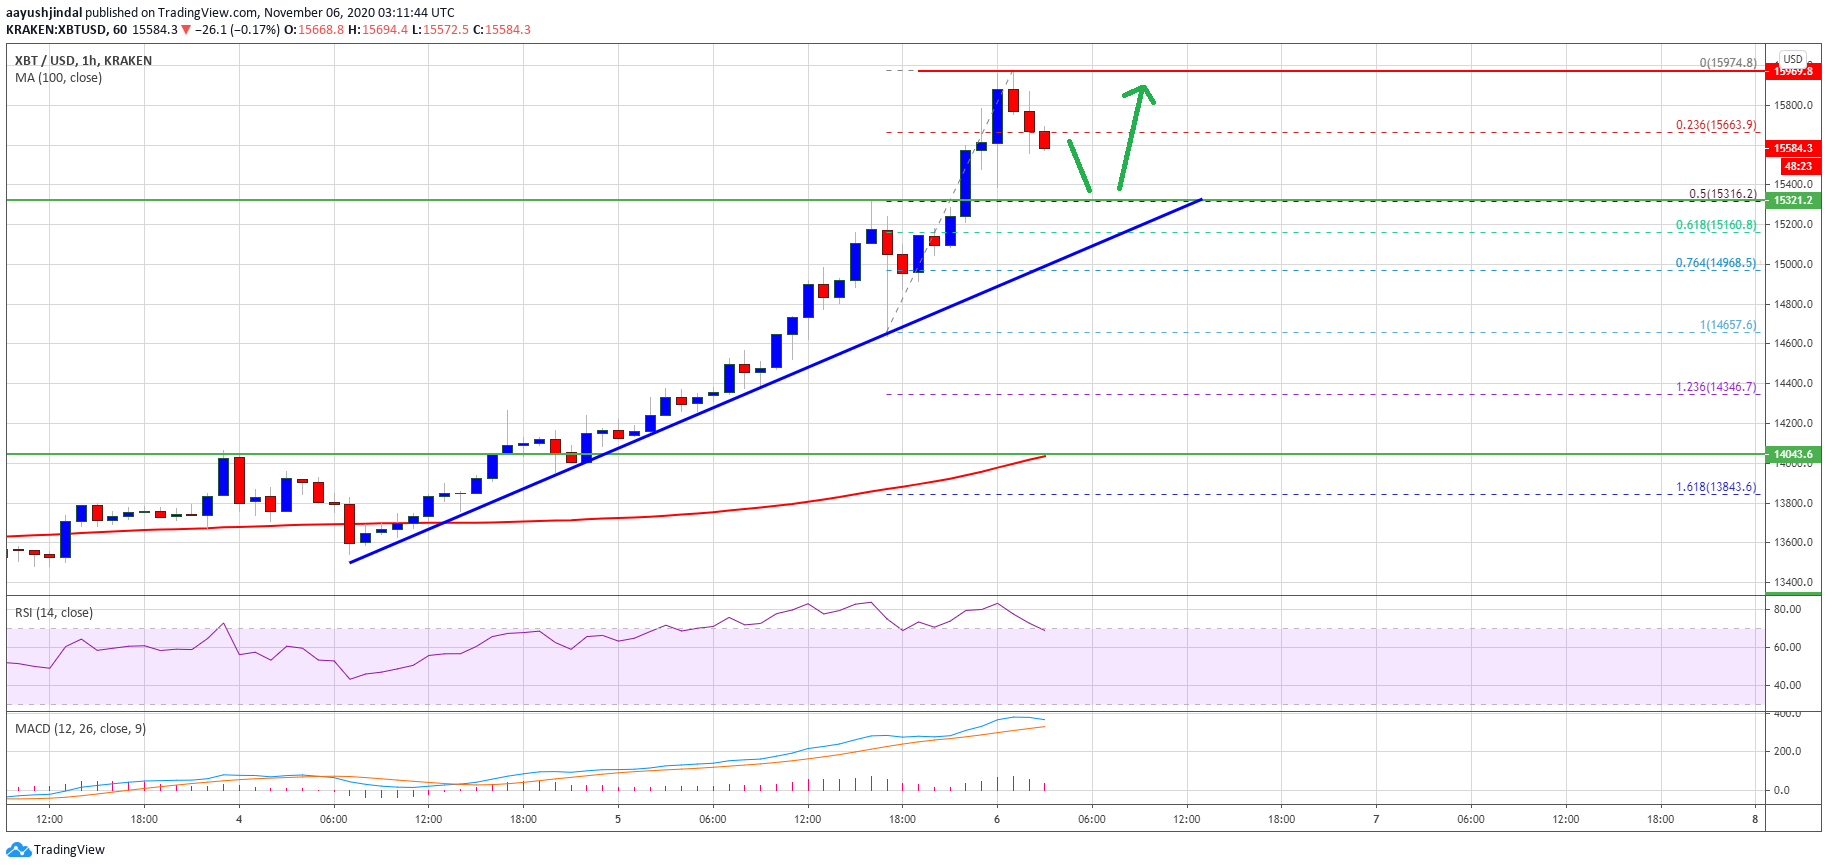
The trend line is close to the 50% Fib retracement level of the recent rally from the $14,657 swing low to $15,974 high. As long as bitcoin price is trading above the trend line support, it could start a fresh upward move. An initial resistance is near the $15,800 level.
The first major resistance is near the $15,920 level, above which the price is likely to surge past the $16,000 barrier in the coming sessions in the near term.
Dips Supported in BTC?
If bitcoin extends its downside correction, it could find bids near the $15,400 and $15,350 level. The first major support on the downside is near the trend line at $15,300.
A downside break below the trend line support could push the price towards the $15,150 support or even towards the $15,000 handle.
Technical indicators:
Hourly MACD – The MACD is slowly losing momentum in the bullish zone.
Hourly RSI (Relative Strength Index) – The RSI for BTC/USD is now correcting lower from the overbought zone.
Major Support Levels – $15,400, followed by $15,300.
Major Resistance Levels – $15,800, $15,920 and $16,000.