
Bitcoin price struggled to settle above the $13,700 resistance and declined below $13,500 against the US Dollar. BTC is likely to retest $13,000 before it could rise again.
- Bitcoin started a fresh decline after it faced a strong selling interest near $13,700.
- The price is trading below the $13,600 support and the 100 hourly simple moving average.
- There was a break below a crucial contracting triangle with support near $13,600 on the hourly chart of the BTC/USD pair (data feed from Kraken).
- The pair is showing bearish signs and it seems like the bears are aiming a test of $13,000.
Bitcoin Price is Facing Hurdles
After a failed attempt to clear the $13,800 barrier, bitcoin price declined below the $13,700 support level. The decline was such that BTC settled below the $13,600 level and the 100 hourly simple moving average.
There was also a break below a crucial contracting triangle with support near $13,600 on the hourly chart of the BTC/USD pair. The pair traded as low as $13,299 before correcting higher. However, the previous support near the $13,700 level and the 100 hourly simple moving average acted as solid hurdles.
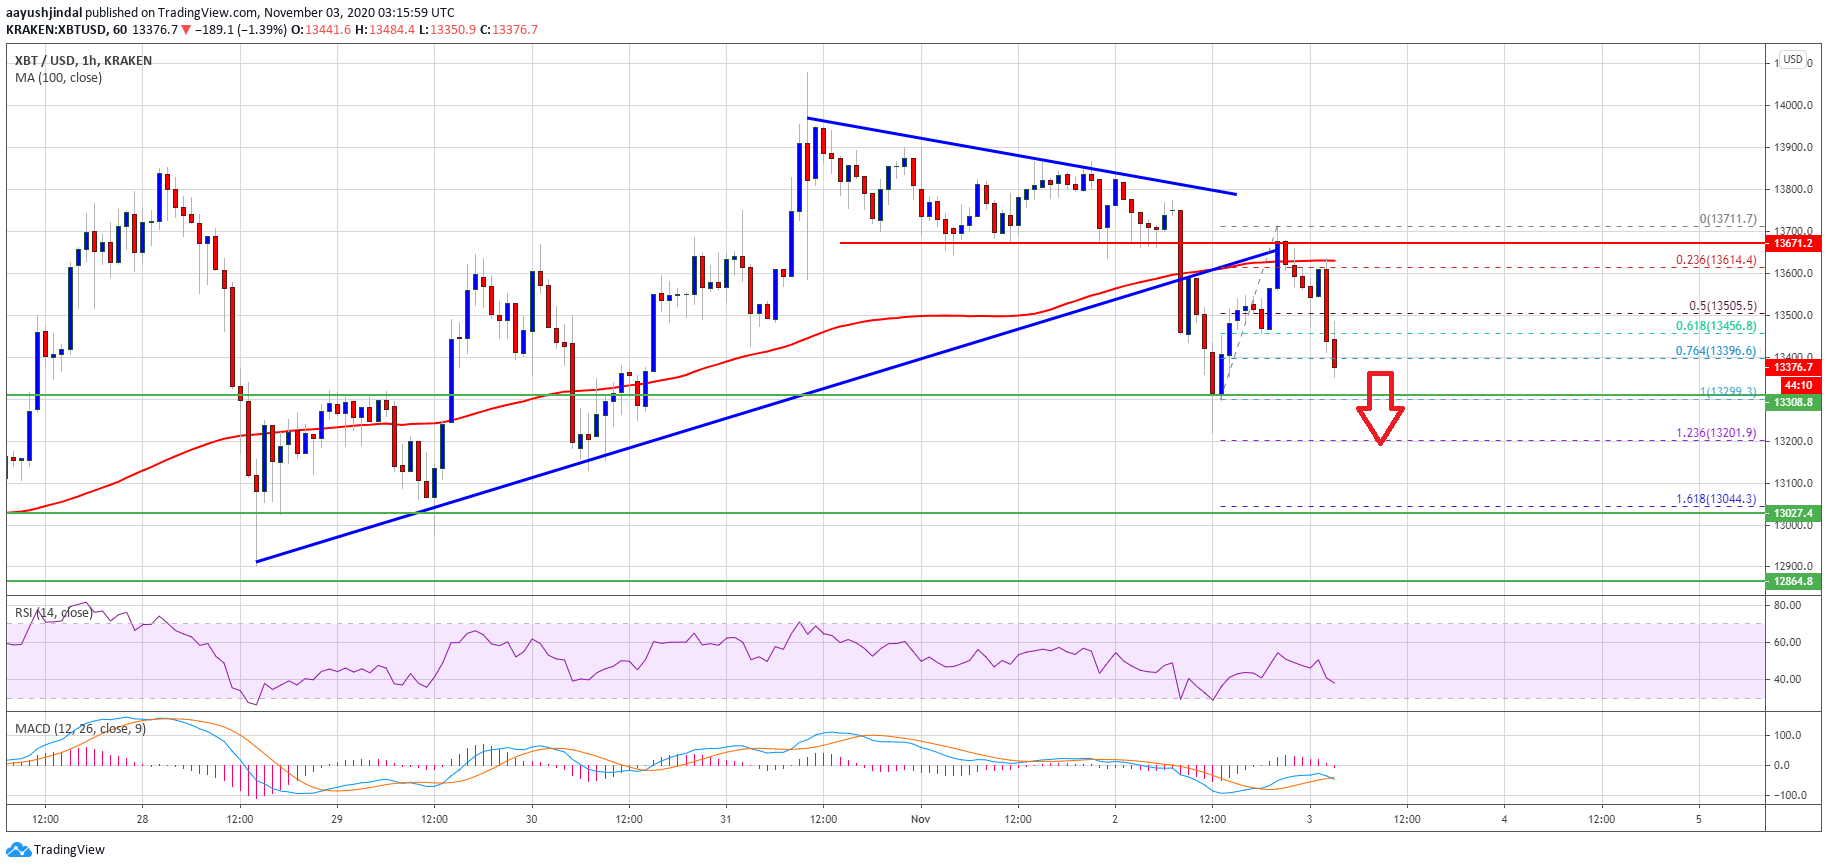
Source: BTCUSD on TradingView.com
A high is formed near $13,711 and the price is now trading below the 50% Fib retracement level of the recent rise from the $13,299 swing low to $13,711 high.
Bitcoin price is now testing the $13,400 zone and the 76.4% Fib retracement level of the recent rise from the $13,299 swing low to $13,711 high. If there is a downside break below $13,400 and $13,320, there is a risk of more losses.
The next major support is near the $13,200 level, below which the bears are likely to aim a retest of the $13,000 support zone in the coming sessions.
Fresh Increase in BTC?
If bitcoin stays above the $13,320 and $13,200 support levels, it could start a fresh increase. An initial resistance on the upside is near the $13,600 level.
The first major hurdle for the bulls is near the $13,700 level and the 100 hourly simple moving average. A clear break above $13,700 and $13,800 is must for a strong push above $14,000.
Technical indicators:
Hourly MACD – The MACD is slowly moving in the bearish zone.
Hourly RSI (Relative Strength Index) – The RSI for BTC/USD is now well below the 50 level.
Major Support Levels – $13,320, followed by $13,200.
Major Resistance Levels – $13,600, $13,700 and $13,800.