
Bitcoin price is slowly rising and it is now trading above $11,400 against the US Dollar. BTC is a bit hesitant, but further gains above $11,550 seems very likely.
- Bitcoin is showing a few positive signs above the $11,350 and $11,400 levels.
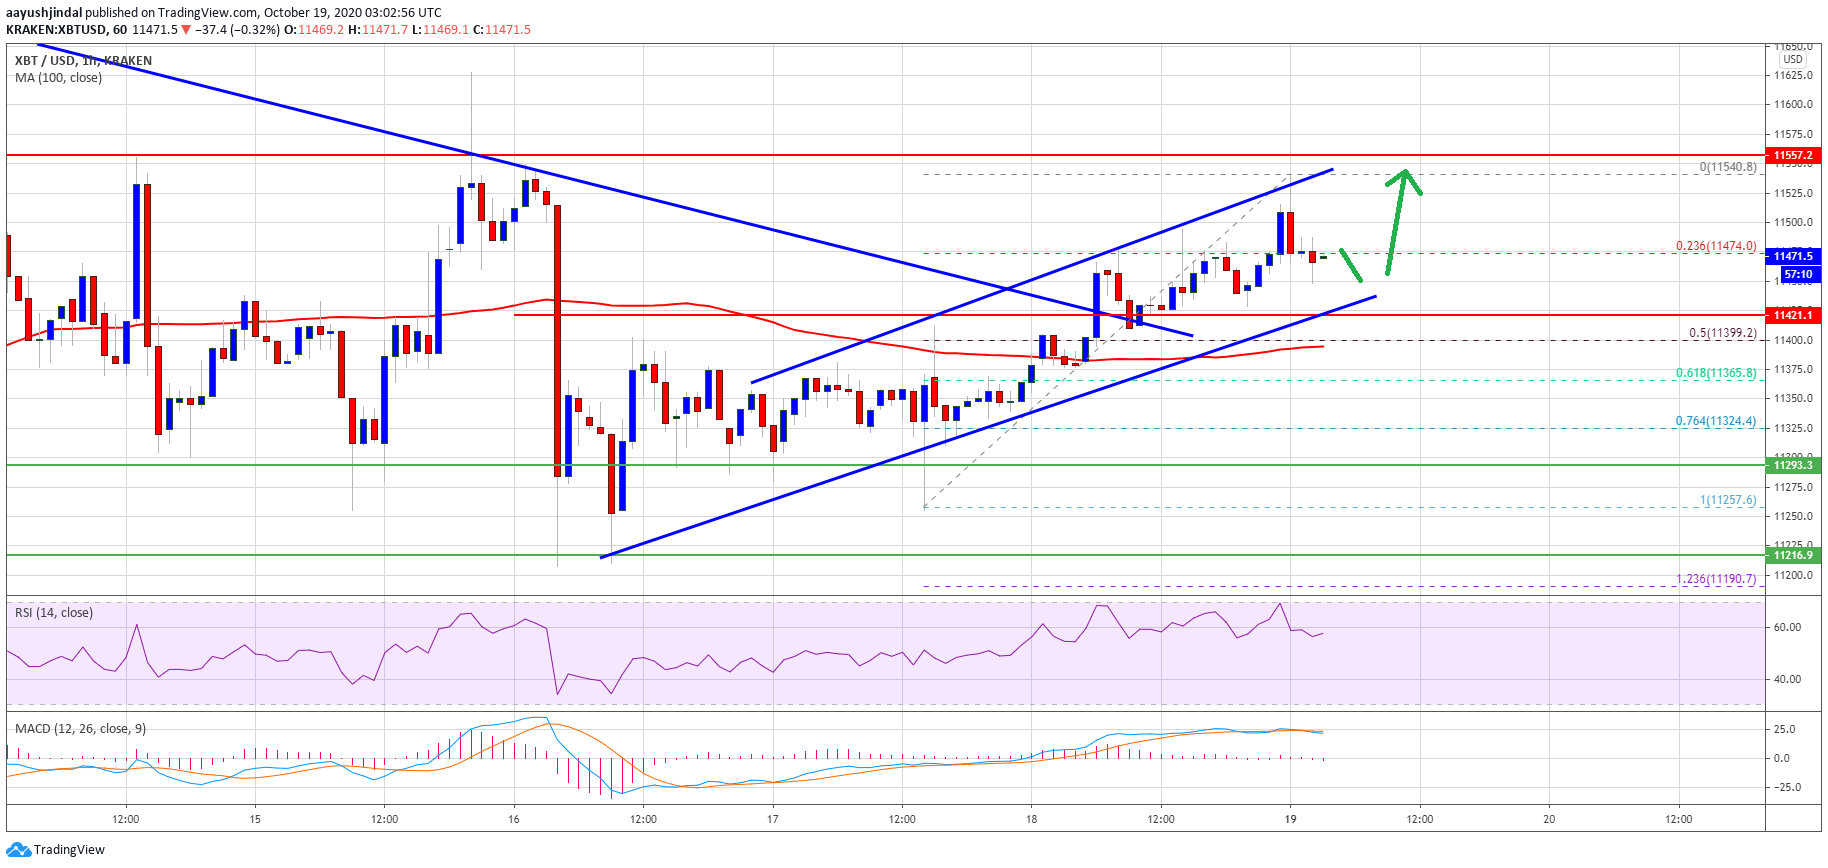
- The price is currently facing hurdles near $11,560, but it is above the 100 hourly simple moving average.
- There is a key rising channel forming with support near $11,420 on the hourly chart of the BTC/USD pair (data feed from Kraken).
- The pair is likely to accelerate higher above $11,560 as long as it is above the $11,300 support.
Bitcoin Price is Rising Steadily
After forming a support base above $11,300, bitcoin price started a slow and steady increase. BTC cleared the $11,400 resistance and the 100 hourly simple moving average to move into a positive zone.
During the rise, there was a break above a connecting bearish trend line with resistance near $11,420 on the hourly chart of the BTC/USD pair. The price even spiked above the $11,500 resistance, but it seems to be facing hurdles near $11,560.
A high is formed near $11,540 and the price is currently correcting lower. There was a break below the $11,500 level. Bitcoin traded below the 23.6% Fib retracement level of the recent rise from the $11,257 low to $11,540 high.
Source: BTCUSD on TradingView.com
On the downside, there is a decent support forming near the $11,400 level. There is also a key rising channel forming with support near $11,420 on the same chart.
The 50% Fib retracement level of the recent rise from the $11,257 low to $11,540 high is close to $11,400 and the 100 hourly simple moving average. On the upside, the price is clearly facing a strong resistance near the $11,550 and $11,560 levels.
A successful break above the $11,560 resistance could open the doors for a larger increase towards the $11,800 and $12,000 resistance levels in the near term.
Downside Break in BTC?
If bitcoin fails to gain strength above $11,560 and $11,600 resistance levels, it could start a fresh drop. The first major support is near the $11,400 level and the 100 hourly simple moving average.
A clear break below the $11,400 support could negate the chances of an upside break above $11,560 in the next 2-3 sessions. The next major support is near the $11,300 level.
Technical indicators:
Hourly MACD – The MACD is slowly moving back into the bearish zone.
Hourly RSI (Relative Strength Index) – The RSI for BTC/USD is now sliding towards the 50 level.
Major Support Levels – $11,420, followed by $11,400.
Major Resistance Levels – $11,560, $11,600 and $11,800.