
Bitcoin price is currently recovering and trading above $11,500 against the US Dollar. BTC is likely to accelerate higher once it clears the $11,700 resistance and the 100 hourly SMA.
- Bitcoin is showing a few positive signs and trading above the $11,500 level.
- The price is testing a major resistance near $11,700 and the 100 hourly simple moving average.
- There is a major bearish trend line forming with resistance near $11,690 on the hourly chart of the BTC/USD pair (data feed from Kraken).
- The pair must settle above the $11,800 level to move into a positive zone in the near term.
Bitcoin Price is Recovering
Bitcoin price formed a decent support base above the $11,350 level and recently started a recovery wave against the US Dollar. BTC broke a couple of key hurdles near the $11,500 and $11,600 levels.
There was also a break above the 50% Fib retracement level of the downward move from the $11,900 swing high to $11,350 swing low. The price is now trading above $11,650, but it is facing a major resistance near $11,700 and the 100 hourly simple moving average.
There is also a major bearish trend line forming with resistance near $11,690 on the hourly chart of the BTC/USD pair. The trend line is close to the 61.8% Fib retracement level of the downward move from the $11,900 swing high to $11,350 swing low.
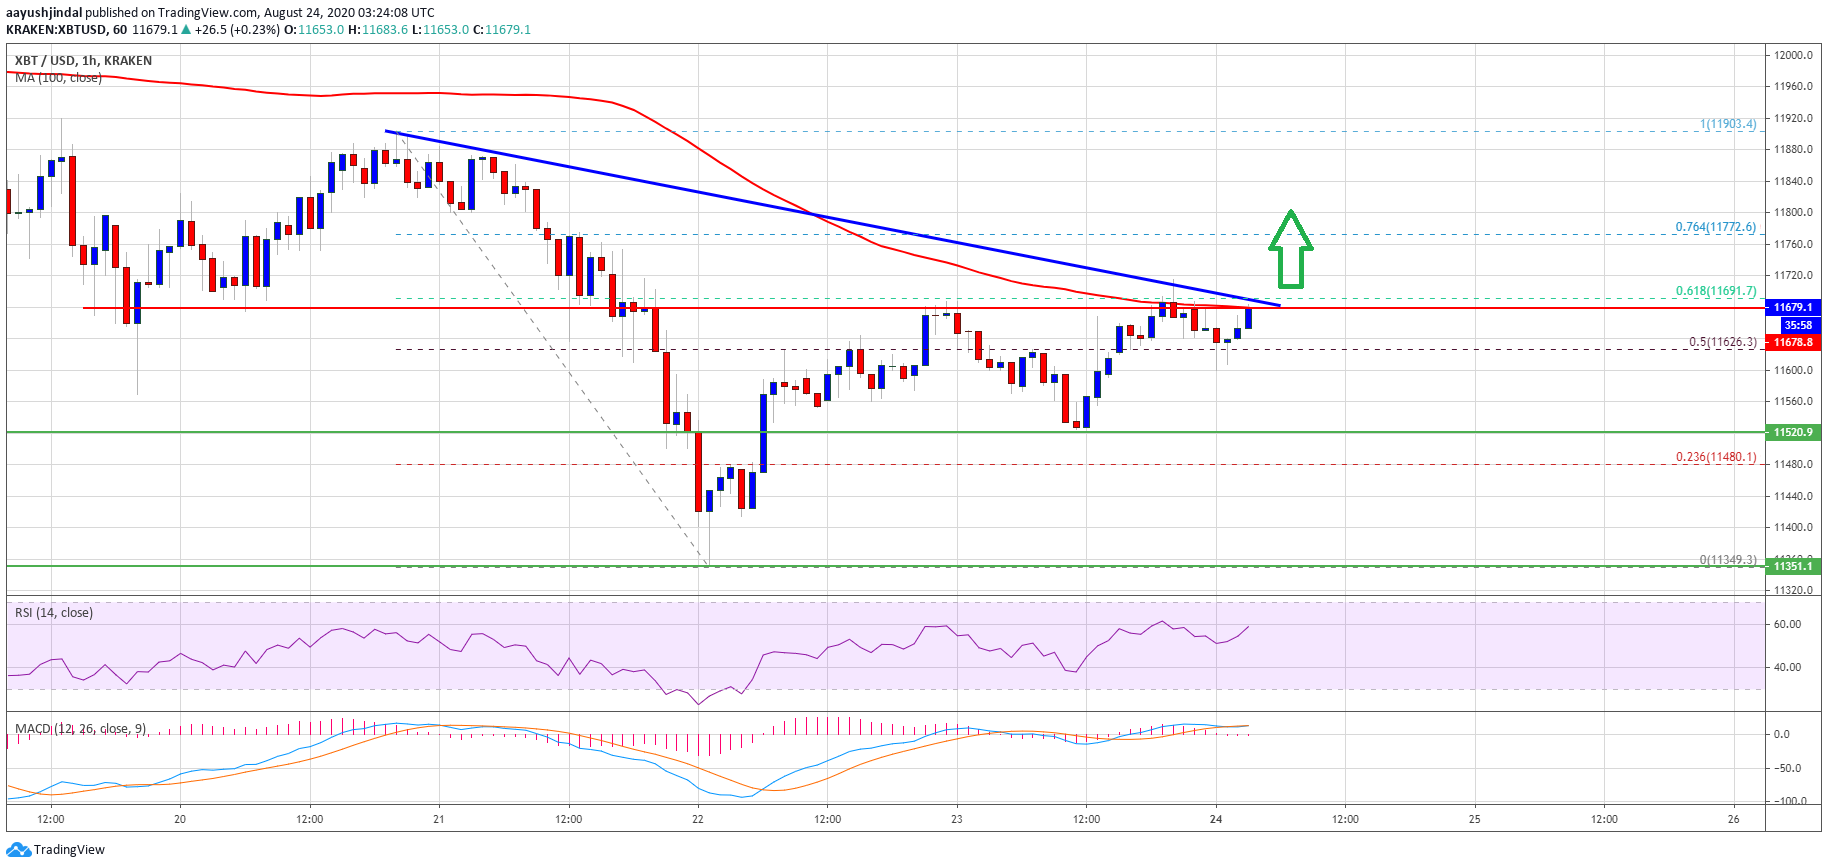
Bitcoin price trades above $11,650. Source: TradingView.com
A successful break above the trend line resistance, $11,700, and the 100 hourly SMA could lead the price towards the $11,800 resistance. A successful close above the $11,800 level might lead the price towards the $12,000 barrier in the coming sessions.
In the mentioned bullish case, the bulls are likely to gain strength and there are chances of a drift towards the $12,500 level.
Fresh Rejection in BTC?
If bitcoin fails to continue higher above the 100 hourly SMA or the $11,700 resistance, there could be a fresh rejection and a bearish reaction.
An initial support on the downside is near the $11,600 level. The first major support is near the $11,520 level, below which the price might dive towards the $11,350 support level in the near term.
Technical indicators:
Hourly MACD – The MACD is slowly losing momentum in the bullish zone.
Hourly RSI (Relative Strength Index) – The RSI for BTC/USD is now well above the 50 level, with a bullish angle.
Major Support Levels – $11,600, followed by $11,520.
Major Resistance Levels – $11,700, $11,800 and $12,000.