
Bitcoin crashed more than $1,500 from the $12,115 high against the US Dollar. BTC is currently consolidating above $11,000 and it must surpass the 100 hourly SMA for a fresh rally.
- Bitcoin is holding a couple of important supports near the $11,000 and $10,850 levels.
- The price seems to be facing a strong resistance near the 100 hourly SMA and $11,450.
- There is a key contracting triangle forming with resistance near $11,200 on the hourly chart of the BTC/USD pair (data feed from Kraken).
- The pair must clear the 100 hourly SMA and $11,450 to start a fresh rally.
Bitcoin Price is Consolidating Losses
There was a strong increase in bitcoin price above the $11,000 and $11,500 levels against the US Dollar. BTC even broke the $12,000 level and traded to a new multi-month high above $12,100.
A high was formed near $12,115 high before the price crashed more than $1,500. It broke many key supports near $11,500 and $11,000. There was a spike below the $10,850 support, but the price stayed above the main $10,500 support zone.
A low is formed near $10,591 and the price is currently correcting higher. There was a break above the $11,000 resistance, plus the 23.6% Fib retracement level of the recent decline from the $12,115 high to $10,591 low.
However, the price seems to be struggling to clear the $11,200 and $11,250 resistance levels. The 100 hourly simple moving average is positioned near the $11,300 level to prevent an upside break. There is also a key contracting triangle forming with resistance near $11,200 on the hourly chart of the BTC/USD pair.
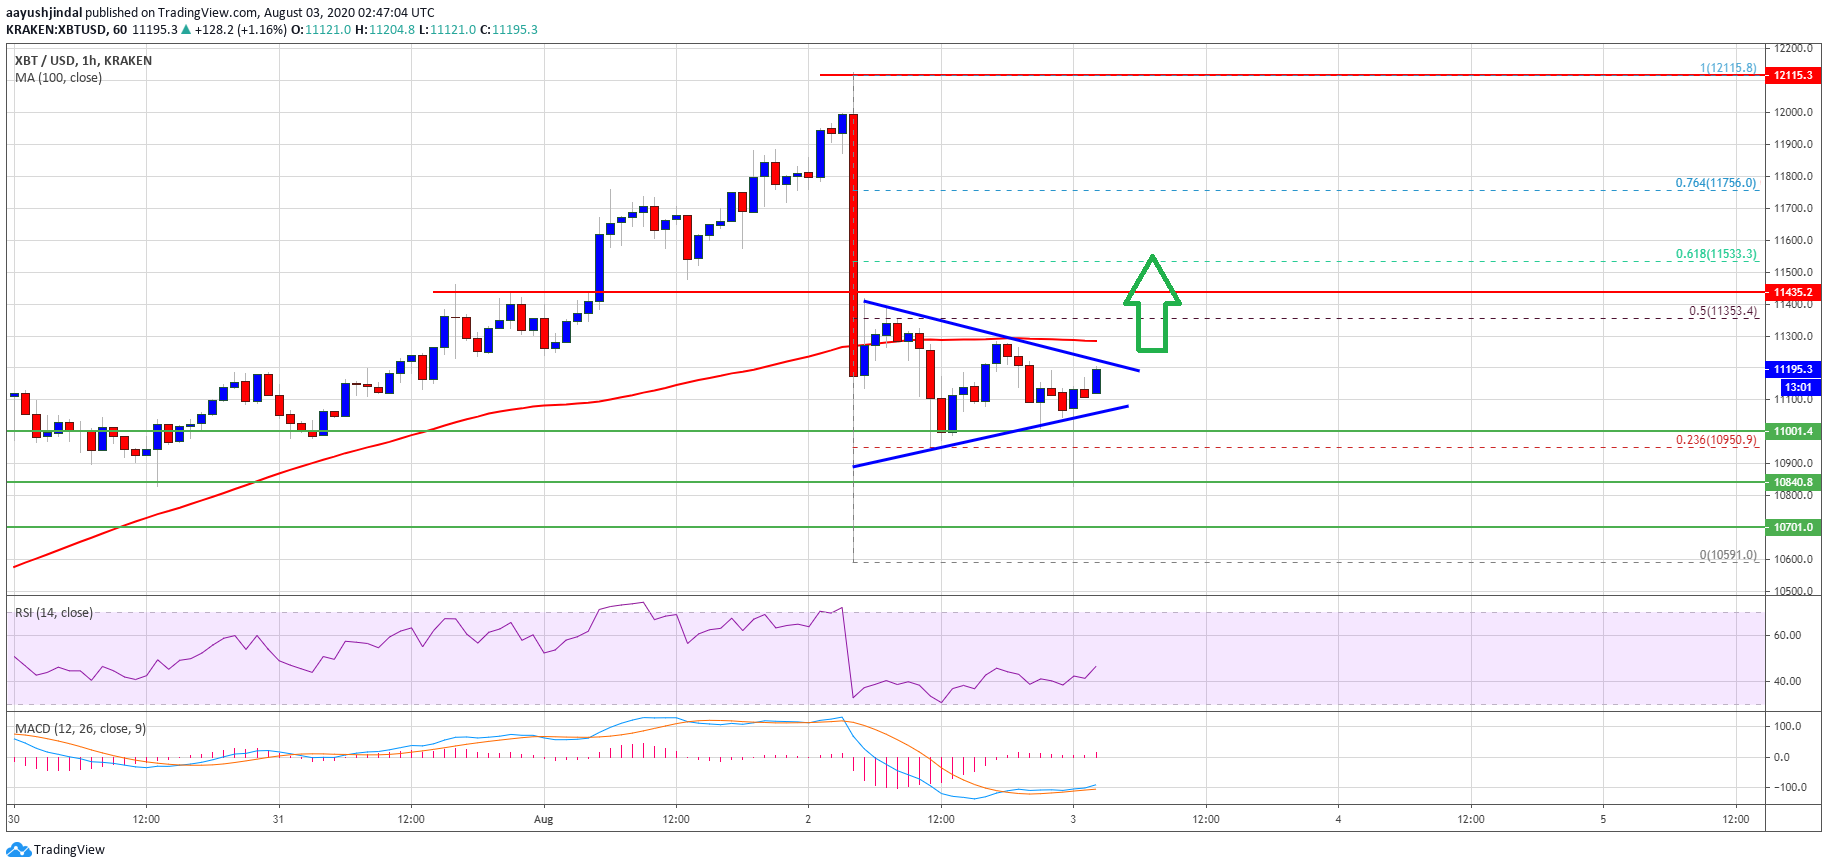
Bitcoin price trades above $11,000. Source: TradingView.com
The pair must clear the triangle resistance and the 100 hourly SMA to start a fresh increase. The next major resistance is near the $11,450 and $11,500 levels. It is close to the 50% Fib retracement level of the recent decline from the $12,115 high to $10,591 low.
A successful close above the $11,500 level will most likely push the price back into a bullish zone. In the mentioned case, the price is likely to climb back towards the $12,000 resistance.
Fresh Decline in BTC?
The triangle support is near the $11,000 level, below which bitcoin price might retest the $10,850 support level in the near term.
The main support is near the $10,600 and $10,500 levels, below which the bears are likely to aim a larger decline (may be towards $10,000).
Technical indicators:
Hourly MACD – The MACD is slowly moving back into the bullish zone.
Hourly RSI (Relative Strength Index) – The RSI for BTC/USD is currently rising towards the 50 level.
Major Support Levels – $11,000, followed by $10,850.
Major Resistance Levels – $11,200, $11,300 and $11,450.