
Bitcoin price is gaining bullish momentum above $19,400 against the US Dollar. BTC spiked above $19,500 and it could continue to rise towards the $20,000 resistance.
- Bitcoin is showing a lot of positive signs above the $19,000 and $19,200 resistance levels.
- The price is now trading above the $19,400 level and the 100 hourly simple moving average.
- There is a key bullish trend line forming with support near $19,220 on the hourly chart of the BTC/USD pair (data feed from Kraken).
- The pair is likely to continue higher above $19,500 and $19,800 in the near term.
Bitcoin Price is Gaining Momentum
After a short-term downside correction from $19,440, bitcoin price found support near $19,000. BTC remained well bid above the $19,000 level and started a fresh increase.
There was a break above the $19,200 and $19,380 resistance levels. The price even broke the $19,440 swing high and extended gains above the $19,500 level. A new monthly high is formed near $19,545 and the price is now trading well above the 100 hourly simple moving average.
Bitcoin price is currently consolidating gains above the $19,400 level. It tested the 23.6% Fib retracement level of the recent increase from the $19,121 swing low to $19,545 high.
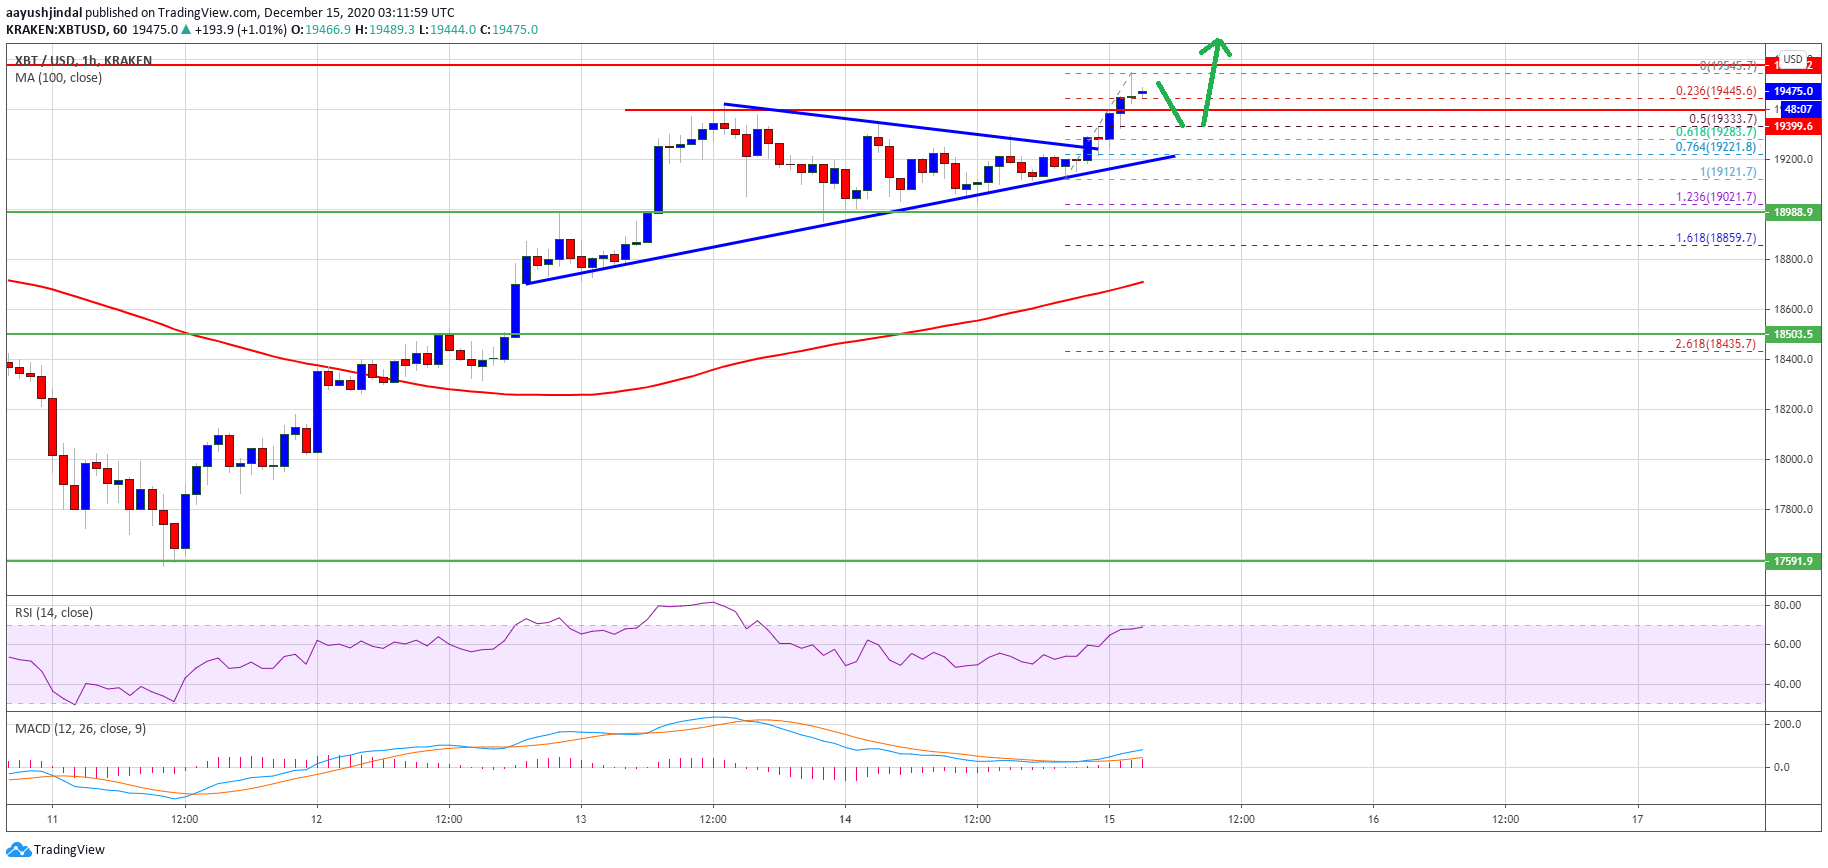
Source: BTCUSD on TradingView.com
The next major support is near the $19,330 level. It is close to the 50% Fib retracement level of the recent increase from the $19,121 swing low to $19,545 high. There is also a key bullish trend line forming with support near $19,220 on the hourly chart of the BTC/USD pair.
On the upside, the price must break the $19,500 and $19,545 levels to continue higher. The next major resistance is near the $19,800 zone. A clear break above $19,800 could increase the chances of a new all-time high above the $20,000 level.
Downsides Supported in BTC?
If bitcoin starts a short-term downside correction, it could find support near the $19,320 level. The first key support is near the bullish trend line or $19,200.
The main support is now forming near the $19,000 zone. A downside break and close below the $19,000 level could start a sharp decline towards the $18,500 level in the near term.
Technical indicators:
Hourly MACD – The MACD is showing positive signs in the bullish zone.
Hourly RSI (Relative Strength Index) – The RSI for BTC/USD is currently well above the 60 level.
Major Support Levels – $19,320, followed by $19,200.
Major Resistance Levels – $19,500, $19,800 and $20,000.