
Bitcoin price is up over 5% and it is trading above the $19,500 level against the US Dollar. BTC bulls seem to be aiming a new all-time high above the $20,000 resistance.
- Bitcoin is rising steadily and it broke a major hurdle at $19,500.
- The price traded as high as $19,860 and it is now well above the 100 hourly simple moving average.
- There is a key contracting triangle forming with resistance near $19,800 on the hourly chart of the BTC/USD pair (data feed from Kraken).
- The pair could start a strong surge once it clears the $19,800 and $19,850 levels.
Bitcoin Price is Approaching $20K
Yesterday, we saw the start of a decent increase in bitcoin price above the $18,500 resistance. BTC remained in a positive zone and cleared the $19,000 resistance.
The price even climbed above the $19,500 resistance and traded to a new 2020. Bitcoin price traded as high as $19,860 and it is now well above the 100 hourly simple moving average. There was a minor downside correction recently below the 23.6% Fib retracement level of the recent wave from the $18,335 swing low to $19,860 high.
There was a spike below the $19,200 level, but dips were limited. The 50% Fib retracement level of the recent wave from the $18,335 swing low to $19,860 high acted as a strong support.
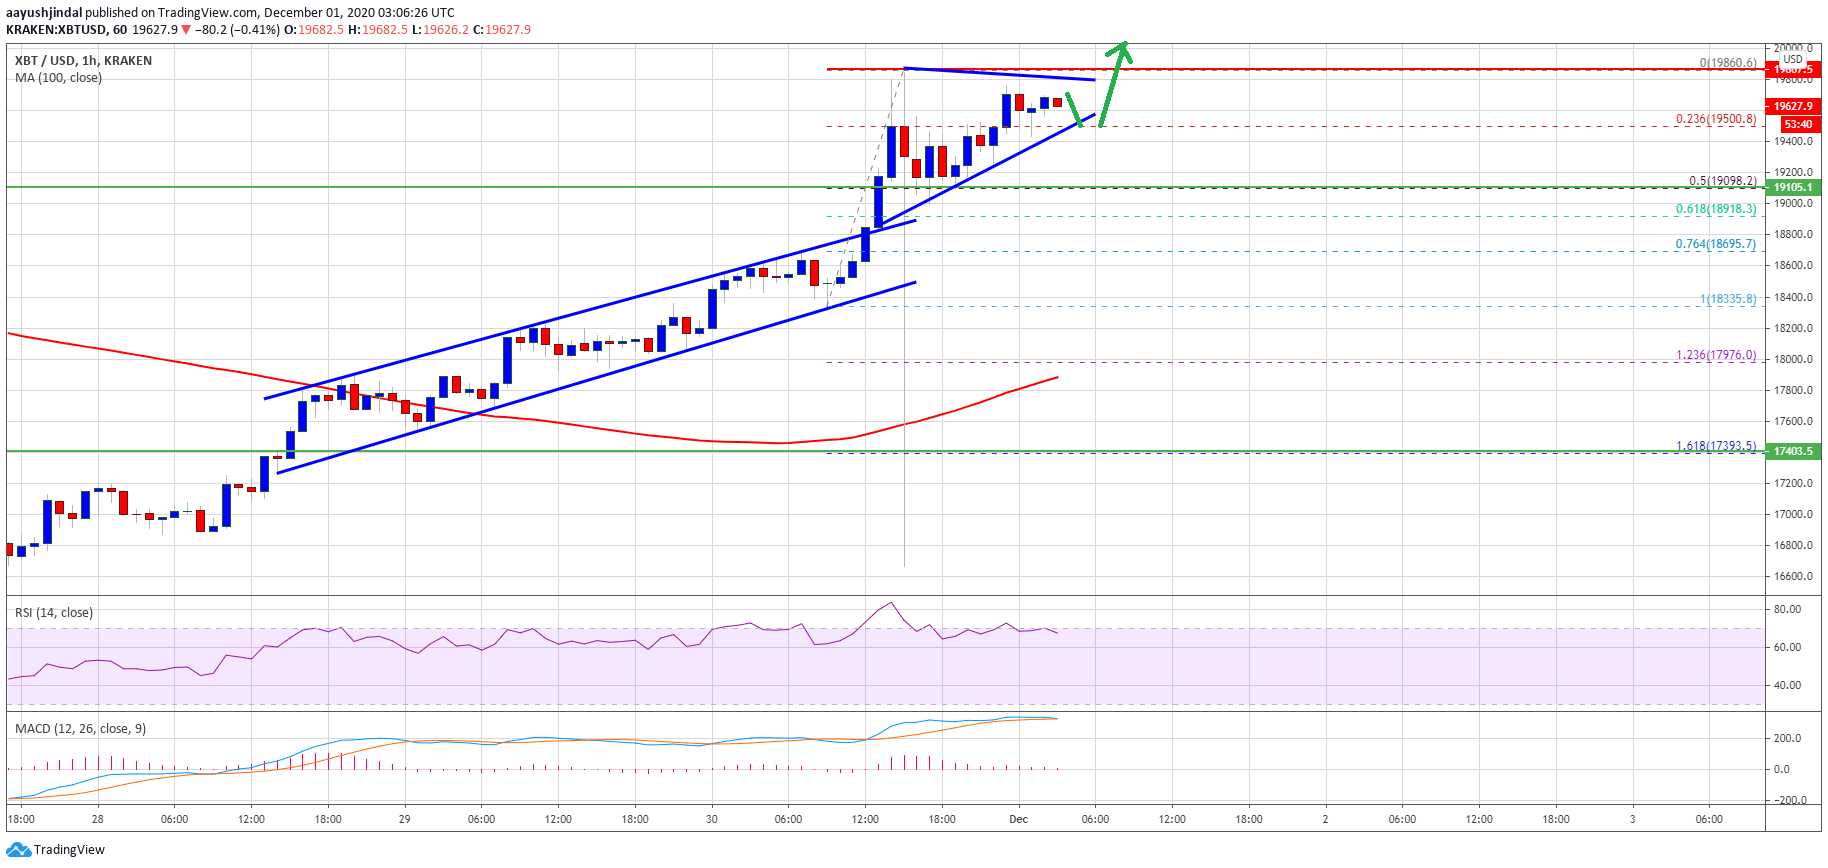
Source: BTCUSD on TradingView.com
Bitcoin formed a support base near $19,200 and it is currently trading above $19,500. There is also a key contracting triangle forming with resistance near $19,800 on the hourly chart of the BTC/USD pair.
If there is a clear break above the triangle resistance and $19,860, the price could start a strong surge in the coming sessions. In the stated case, the bulls might aim a new all-time high above the $20,000 level.
Downside Correction in BTC?
If bitcoin fails to clear the triangle resistance at $19,800, there could be a short-term downside correction. An initial support on the downside is near the triangle lower trend line at $19,550.
A clear break below the triangle support might start an extended decline towards $19,200. The next major support below the $19,200 level is near the $18,800 level (a multi-touch zone).
Technical indicators:
Hourly MACD – The MACD is slowly losing momentum in the bullish zone.
Hourly RSI (Relative Strength Index) – The RSI for BTC/USD is currently correcting lower from the 70 level.
Major Support Levels – $19,550, followed by $19,200.
Major Resistance Levels – $19,800, $19,860 and $20,000.