
Bitcoin price is holding the $11,650 and $11,550 support levels against the US Dollar. BTC is currently recovering, but it must surpass the 100 hourly SMA to start a fresh surge.
- Bitcoin is still trading nicely above the $11,650 and $11,550 support levels, with positive signs.
- The price is likely to face a strong resistance near $11,950 and the 100 hourly simple moving average.
- There was a break above a crucial bearish trend line with resistance near $11,810 on the hourly chart of the BTC/USD pair (data feed from Kraken).
- The pair must settle above the $12,000 pivot level to start a fresh surge in the near term.
Bitcoin Price is Slowly Recovering
After a sharp downside correction, bitcoin price found support above $11,550 against the US Dollar. BTC remained well bid above the $11,550 level, but it settled below the 100 hourly simple moving average.
A swing low is formed near $11,581 and the price is currently recovering. It broke the $11,800 resistance zone, plus there was a break above the 23.6% Fib retracement level of the downward move from the $12,491 high to $11,580 swing low.
Moreover, there was a break above a crucial bearish trend line with resistance near $11,810 on the hourly chart of the BTC/USD pair. Bitcoin is clearly showing a few positive signs above the $11,800 level, but it is facing a strong resistance near $11,950 and the 100 hourly simple moving average.
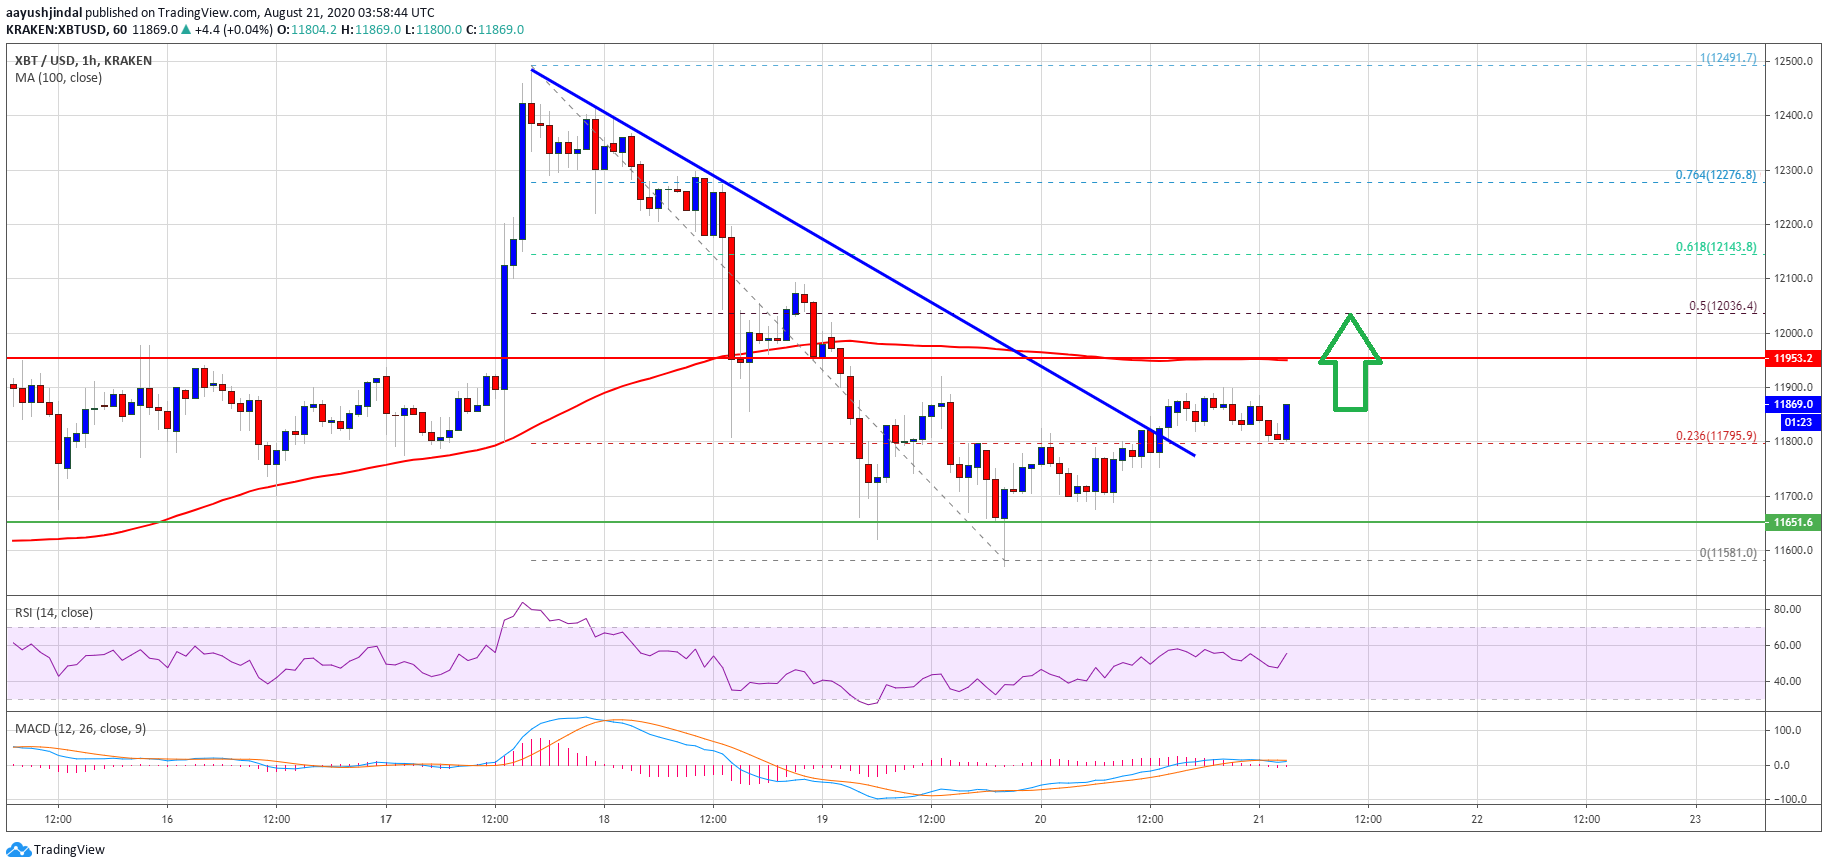
Bitcoin price trades above $11,800. Source: TradingView.com
The 50% Fib retracement level of the downward move from the $12,491 high to $11,580 swing low is also near $12,035. Therefore, the bulls need to clear the 100 hourly SMA and then gain strength above $12,000 to start a fresh increase in the coming sessions.
In the mentioned case, the price could easily drift towards the $12,150 and $12,250 levels. The main hurdle is still near the $12,500 level for a larger upward move.
Fresh Decline in BTC?
If bitcoin fails to continue higher above the 100 hourly SMA or the $12,000 barrier, there are chances of a fresh decline. An initial support is near the $11,650 level.
The main support on the downside is near the $11,550 level. If there is a proper close below $11,550 and $11,500, there is a risk of a larger decline towards $11,200 or $11,000.
Technical indicators:
Hourly MACD – The MACD is slowly moving into the bullish zone.
Hourly RSI (Relative Strength Index) – The RSI for BTC/USD is now above the 50 level.
Major Support Levels – $11,650, followed by $11,500.
Major Resistance Levels – $11,950, $12,000 and $12,050.