
Bitcoin price is gaining traction and it broke $13,500 and $13,800 resistance levels against the US Dollar. BTC is likely to continue higher above the $14,000 resistance.
- Bitcoin is up over 5% and it surpassed the main $13,500 resistance level.
- The price is trading with a positive angle above $13,800 and the 100 hourly simple moving average.
- There was a break above a major bearish trend line with resistance near $13,100 on the hourly chart of the BTC/USD pair (data feed from Kraken).
- The pair is likely to gain strength above the $14,000 resistance level in the near term.
Bitcoin Price is Gaining Momentum
Bitcoin price remained in a positive zone after it cleared the key $13,500 resistance zone. BTC settled nicely above the $13,500 level and the 100 hourly simple moving average to open the doors for more gains.
More importantly, there was a break above a major bearish trend line with resistance near $13,100 on the hourly chart of the BTC/USD pair. The pair gained momentum and it even broke the $13,800 resistance level.
A high is formed near $13,851 and the price is showing no major signs of trend exhaustion. If there is a downside correction, the $13,750 level is an initial support. It is close to the 23.6% Fib retracement level of the recent wave from the $13,352 swing low to $13,851 high.
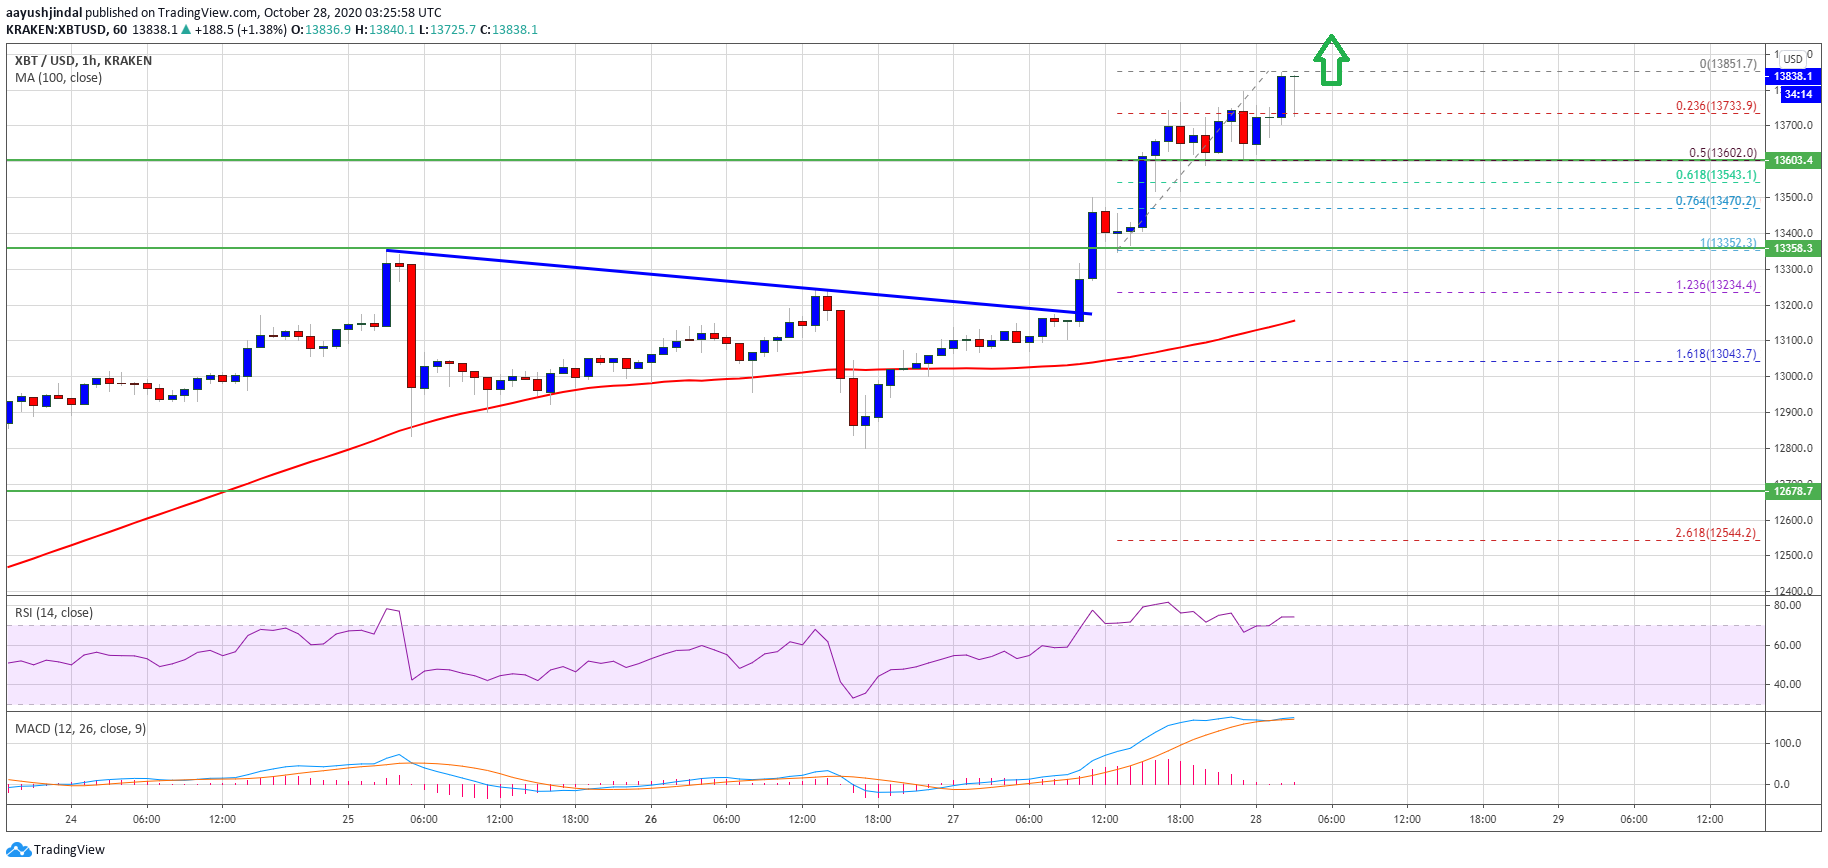
Source: BTCUSD on TradingView.com
The first major support is near the $13,600 level. It represents the 50% Fib retracement level of the recent wave from the $13,352 swing low to $13,851 high.
On the upside, the $13,850 level is a short-term resistance. The main resistance is near the $14,000 level, above which the bulls are likely to gain strength for another rally. The next stop could be $14,200 or even $14,400.
Downside Correction in BTC?
If bitcoin fails to climb above the $13,850 or $14,000 resistance levels, there is a risk of a short-term downside correction. An initial support is near the $13,750 zone.
The main support is near the $13,600 and $13,500 levels, below which there are chances of a larger decline towards the $13,000 support level (the previous breakout zone).
Technical indicators:
Hourly MACD – The MACD is now gaining momentum in the bullish zone.
Hourly RSI (Relative Strength Index) – The RSI for BTC/USD is now well above the 50 level, with positive signs.
Major Support Levels – $13,750, followed by $13,600.
Major Resistance Levels – $13,850, $14,000 and $14,000.