
Bitcoin price is facing a strong resistance near the $27,300 area against the US Dollar. BTC could correct lower towards $26,000 or $25,500 in the near term.
- Bitcoin seems to be struggling to gain bullish momentum above the $27,300 barrier.
- The price is currently trading above the $26,500 support and the 100 hourly simple moving average.
- There is a key bullish trend line forming with support near $26,650 on the hourly chart of the BTC/USD pair (data feed from Kraken).
- The pair is likely to continue lower if there is a break below $26,600 and $26,500.
Bitcoin Price Could Retest $26K
After forming a base above the $26,500 support, bitcoin price climbed above $27,000. BTC remained well bid above the $26,800 level and the 100 hourly simple moving average.
There was a break above the $27,200 level. The price even spiked above the 50% Fib retracement level of the downward move from the $28,388 swing high to $25,782 low. However, the price seems to be facing a strong resistance near the $27,300 zone.
The 61.8% Fib retracement level of the downward move from the $28,388 swing high to $25,782 low is also acting as a strong resistance. Bitcoin price is currently showing a few bearish, but it is holding the $26,500 support.
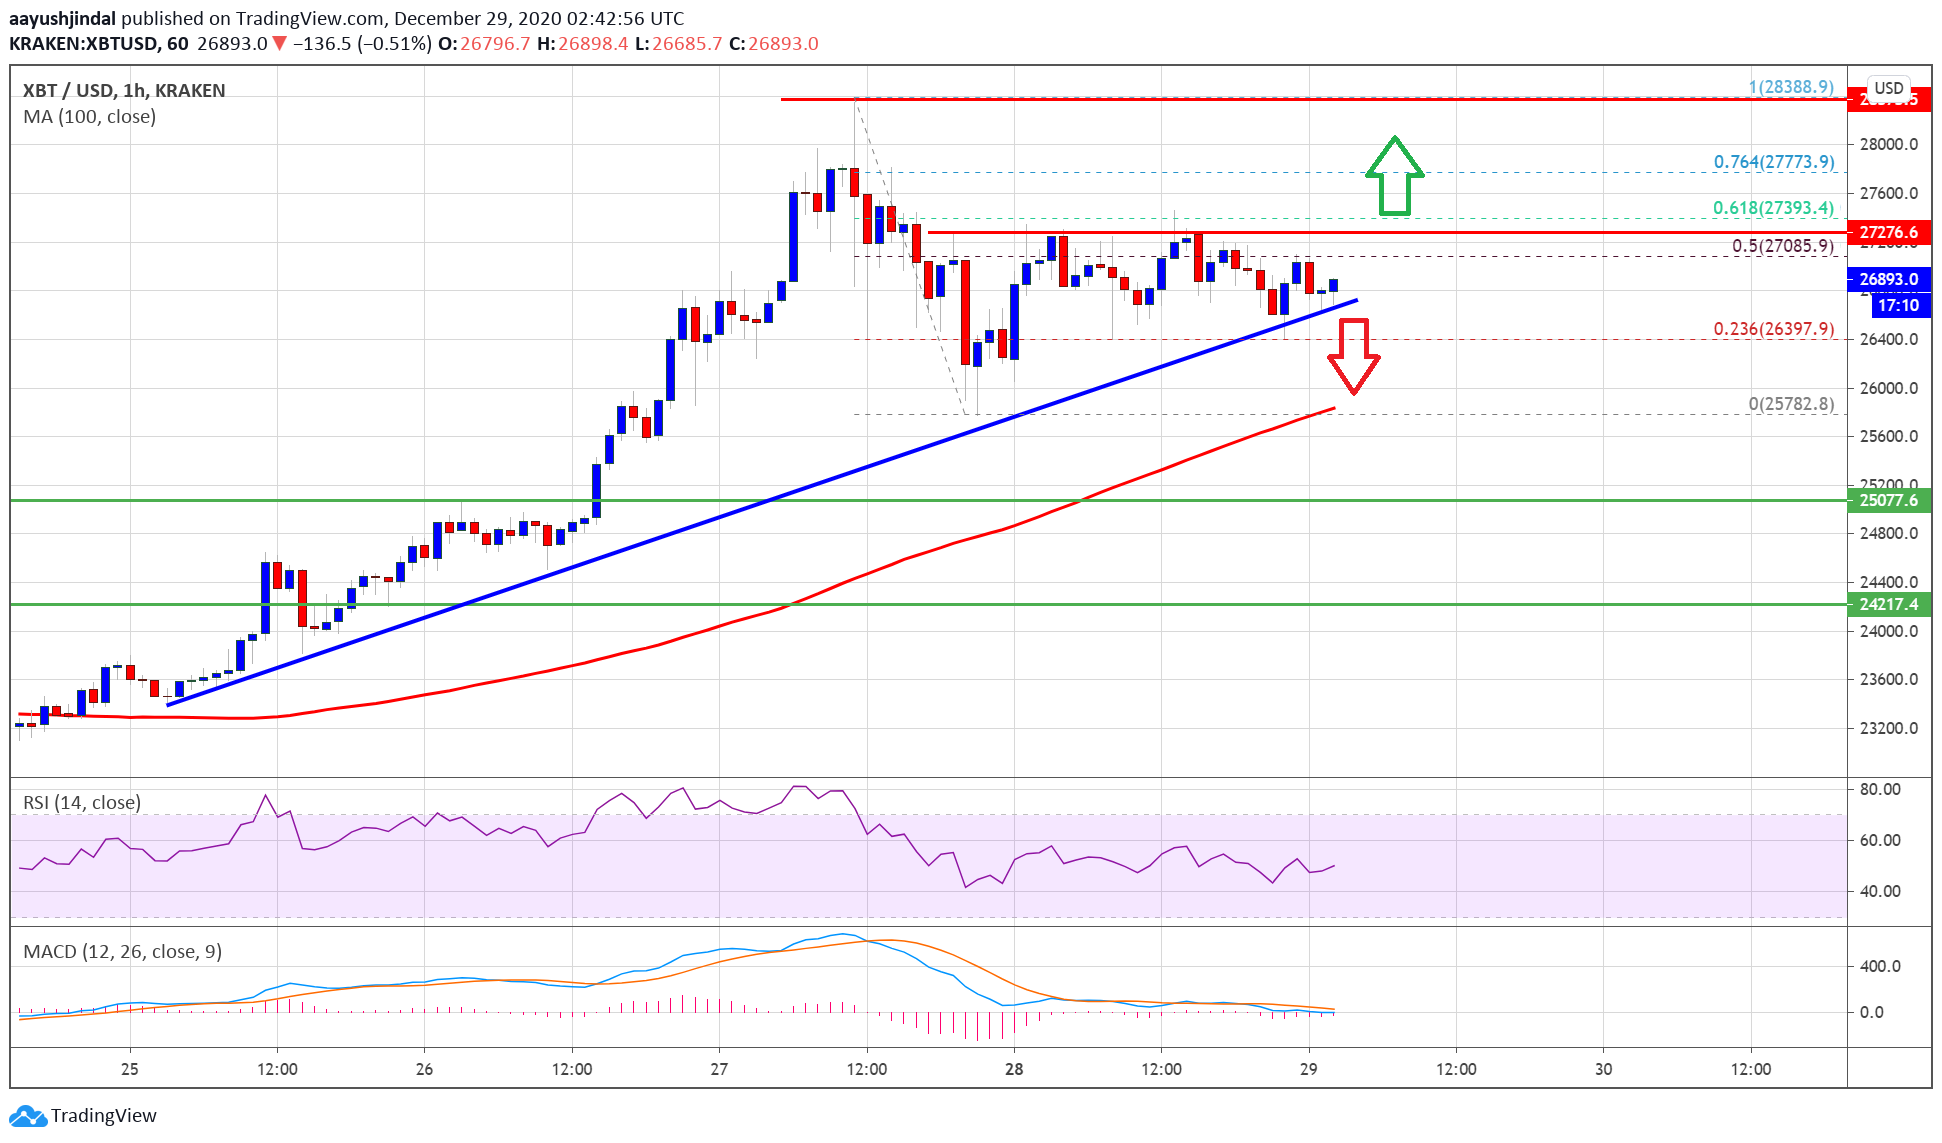
Source: BTCUSD on TradingView.com
There is also a key bullish trend line forming with support near $26,650 on the hourly chart of the BTC/USD pair. If there is downside break below the trend line support, the price could even trade below the $26,500 support. The next major support is near the $26,000 level.
Any more losses might put the 100 hourly SMA and $25,800 at a risk. In the stated case, the price may perhaps decline towards the $25,200 level.
Upside Break in BTC?
If bitcoin remains stable above the trend line support or $26,500, it could attempt an upside break. The main resistance is near the $27,300 zone.
A clear break above the $27,300 resistance zone could open the doors for a larger increase. In the stated case, the price could rise towards the $28,000 resistance. The next key hurdle sits at $28,200 and $28,400.
Technical indicators:
Hourly MACD – The MACD is losing momentum in the bullish zone.
Hourly RSI (Relative Strength Index) – The RSI for BTC/USD is currently declining towards the 40 level.
Major Support Levels – $26,500, followed by $26,000.
Major Resistance Levels – $27,300, $28,000 and $28,400.