
Bitcoin price started a downside correction from well above $16,200 against the US Dollar. BTC is likely to accelerate losses if there is a clear break below the $15,800 support.
- Bitcoin failed to stay above the $16,200 support and extended its decline.
- The price is currently trading below $16,000 and the 100 hourly simple moving average.
- There is a key bearish trend line forming with resistance near $16,050 on the hourly chart of the BTC/USD pair (data feed from Kraken).
- The pair remains at a risk of a sharp decline if there is a clear break below the $15,800 support.
Bitcoin Price Could Decline Further
After struggling to gain pace above the $16,500 level, bitcoin price started a downside correction. BTC broke the $16,200 support level and settled below the 100 hourly simple moving average to move into a short-term bearish zone.
It even broke the $16,000 handle, but the bulls were able to protect $15,800. The recent swing low was formed near $15,803 before the price started a minor upward move. There was a break above the $15,900 and $15,950 levels.
Bitcoin price even spiked above the 50% Fib retracement level of the recent decline from the $16,172 high to $15,803 swing low. The price is now struggling to recover above the $16,000 zone and the 100 hourly simple moving average.
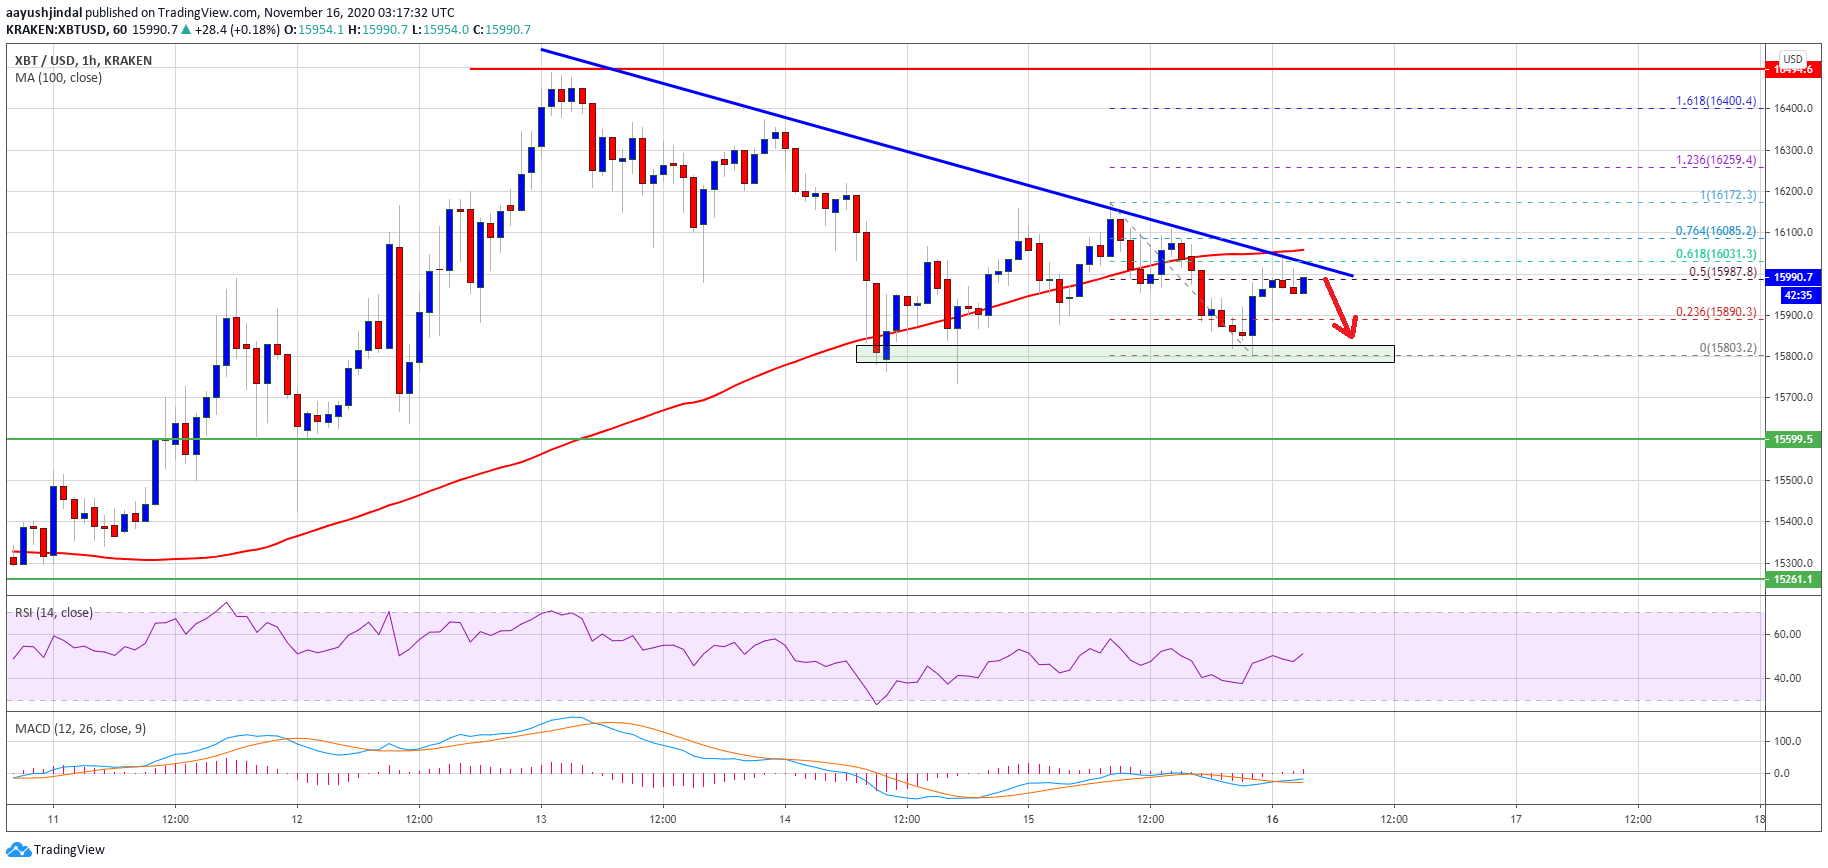
Source: BTCUSD on TradingView.com
There is also a key bearish trend line forming with resistance near $16,050 on the hourly chart of the BTC/USD pair. The trend line is close to the 61.8% Fib retracement level of the recent decline from the $16,172 high to $15,803 swing low.
A clear break above the trend line resistance, $16,100 and the 100 hourly SMA could open the doors for a fresh increase in the coming sessions.
Downside Break in BTC?
If bitcoin fails to clear the trend line resistance, $16,100 and the 100 hourly SMA, there is a risk of a downside break. The first major support on the downside is near the $15,800 level.
A downside break below the $15,800 support may perhaps put a lot of pressure on the bulls. In the stated case, the price is likely to decline towards the $15,500 support or even $15,200.
Technical indicators:
Hourly MACD – The MACD is slowly losing momentum in the bullish zone.
Hourly RSI (Relative Strength Index) – The RSI for BTC/USD is currently close to the 50 level.
Major Support Levels – $15,800, followed by $15,500.
Major Resistance Levels – $16,000, $16,050 and $16,200.