
Making money with Bitcoin is easy, right? Just HODL for long enough and reap the rewards.. But what if you want to do more?
Trading requires a greater understanding of the market and its various metrics, but sometimes analysts just seem to be speaking an alien language.
So how are you supposed to know your CV-DD from your NVT Cap? Thankfully, crypto-analyst Adam Taché compiled some handy guides, which we’ll go through in this, and its companion off-chain metrics article.
Realised Cap/Price
The ‘Realised Cap’ metric addresses deficiencies in using pure market cap when dealing with Bitcoin and cryptocurrencies. Market cap, formed as the product of current price * current supply, does not take into account lost, unclaimed, or unspendable coins.
Instead, Realised Cap sums the value of each coin the last time it moved. Therefore, lost coins and those which have been out of circulation for some time are not valued at current prices. Of course, one issue is that this cannot differentiate between truly lost coins and those in deep cold storage. Although we can consider these long-term hodl’ed coins as equivalent to lost until they move (are found).
The ‘Realised Price’ is a volume-weighted average price (VWAP), which approximates the average price paid for circulating BTC.
Balanced Price and Bitcoin Days Destroyed
To understand ‘Balanced Price’ (and the following Cumulative Value-Days Destroyed), we need to understand the concept of ‘CoinDays Destroyed‘.
CoinDays Destroyed (CDD) is a volume metric which gives more weight to coins based on how long they have been held. A CoinDay is created when 1 bitcoin is not moved for one day. If that 1 BTC is finally moved after 100 days, then it has built up 100 CoinDays and the transaction will result in 100 CDD. If it is then immediately moved again, that will cause zero additional CoinDays Destroyed,
Using this we can calculate Transferred Price, which uses supply to bring CDD into the Bitcoin price domain and can be considered as a moving average of price spent. It takes the summation of all CDD multiplied by price (at time of destruction), and divides this by the market age (in days) multiplied by current supply.
The Balanced Price is the Realised Price (avg. paid) minus the Transferred Price (avg. spent), and aims to be a ‘fair’ valuation measure. During bear markets, when bitcoin price falls to this level, it is a good indication that full-detox has been achieved. i.e. the market is about to turn.
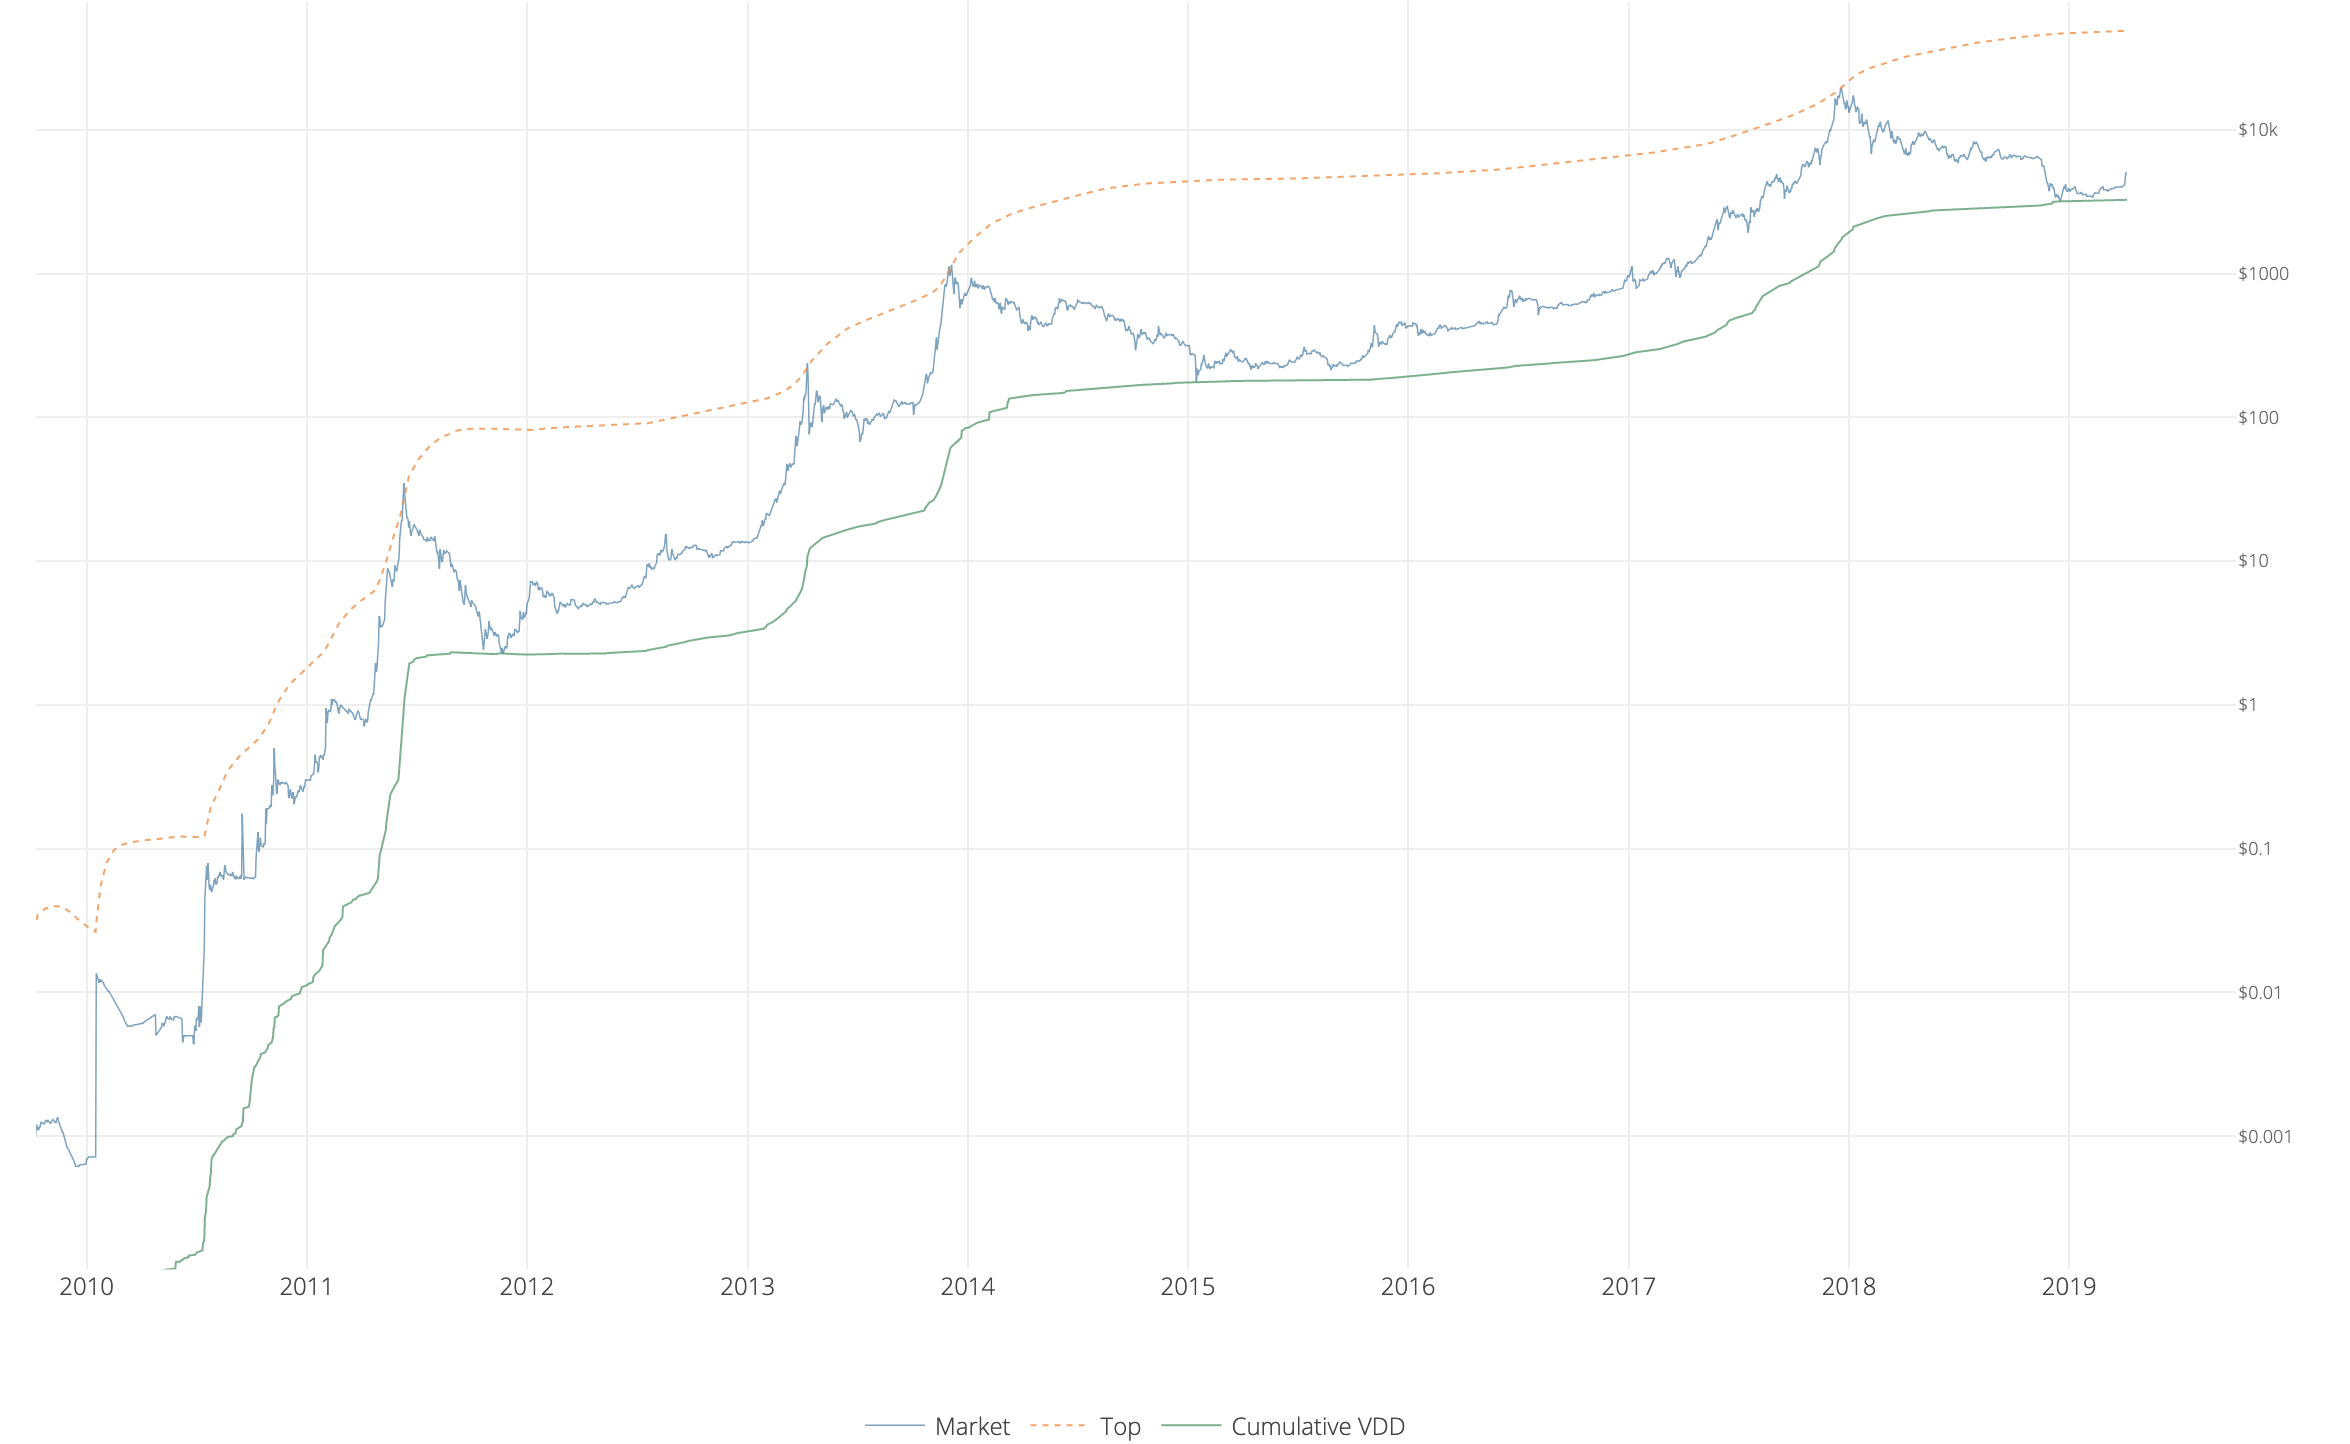
Cumulative Value-Days Destroyed
‘Cumulative Value-days Destroyed’ (CVDD) is another approach to bring CDD into the price domain. It is calculated in exactly the same way as Transferred Price, but with one slight difference. Instead of using supply (which increases over time) as a divisor, it uses the constant value of 6,000,000. This is an arbitrary figure used to calibrate the chart, and would be different if the market age (time since genesis block) was measured in hours or blocks rather than days.
With this calibration, CVDD hits historical price bottoms in 2011, 2015, and 2018, with incredible accuracy.
Both CVDD and Balanced Price are explained in more detail here.
Delta Cap
‘Delta Cap’ is another Bitcoin metric devised to catch market bottoms and predict new bull runs. It is calculated as the Realised Cap minus the Average Cap (simple moving average to date).
Top Cap
‘Top Cap’ metric is a simple metric comprising the Average Cap multiplied by 35. It has been very efficient at hitting global market ‘tops’ to date, and when used in conjunction with CVDD provides upper and lower bands for price action.
Thermo Cap
‘Thermo Cap’ is used as a proxy to measure inflow of capital into Bitcoin. It is the sum of coinbase tx rewards at the price that they were mined, and represents the cumulative security spend by the network.
NVT Ratio
Finally, the ‘Network Value to Transactions (NVT) Ratio’ is a measure of Bitcoin’s monetary velocity. It is determined as the market cap (network value) divided by the daily USD value transmitted through the blockchain.
As Bitcoin is a store of value network, volume represents investor flows. As such NVT Ratio is roughly analogous to the Price to Earnings (P/E) Ratio used in equity markets. It can give a good indication of whether Bitcoin is under or over-valued.
Charting Metrics
Many of these metrics are experimental, and although they seem to accurately chart past performance, cannot be relied on for future predictions. However, they are certainly a useful tool for analysing the market and its cycles.
All of these metrics can be charted and studied on the Woobull Charts website from Woonomics.
The next article in this series will look at some of the off-chain indicators used by analysts, which are largely derived from these on-chain valuation models.
Feel smarter already? Let us know what you think about these metrics in the comment section below!
Images courtesy of Twitter @Adam_Tache, Shutterstock
The post Bitcoin On-Chain Metrics That Every Trader Should Know appeared first on Bitcoinist.com.