
Bitcoin price remained stable above the $17,500 support against the US Dollar. BTC is showing bullish signs and a close above $18,200 could start a fresh surge.
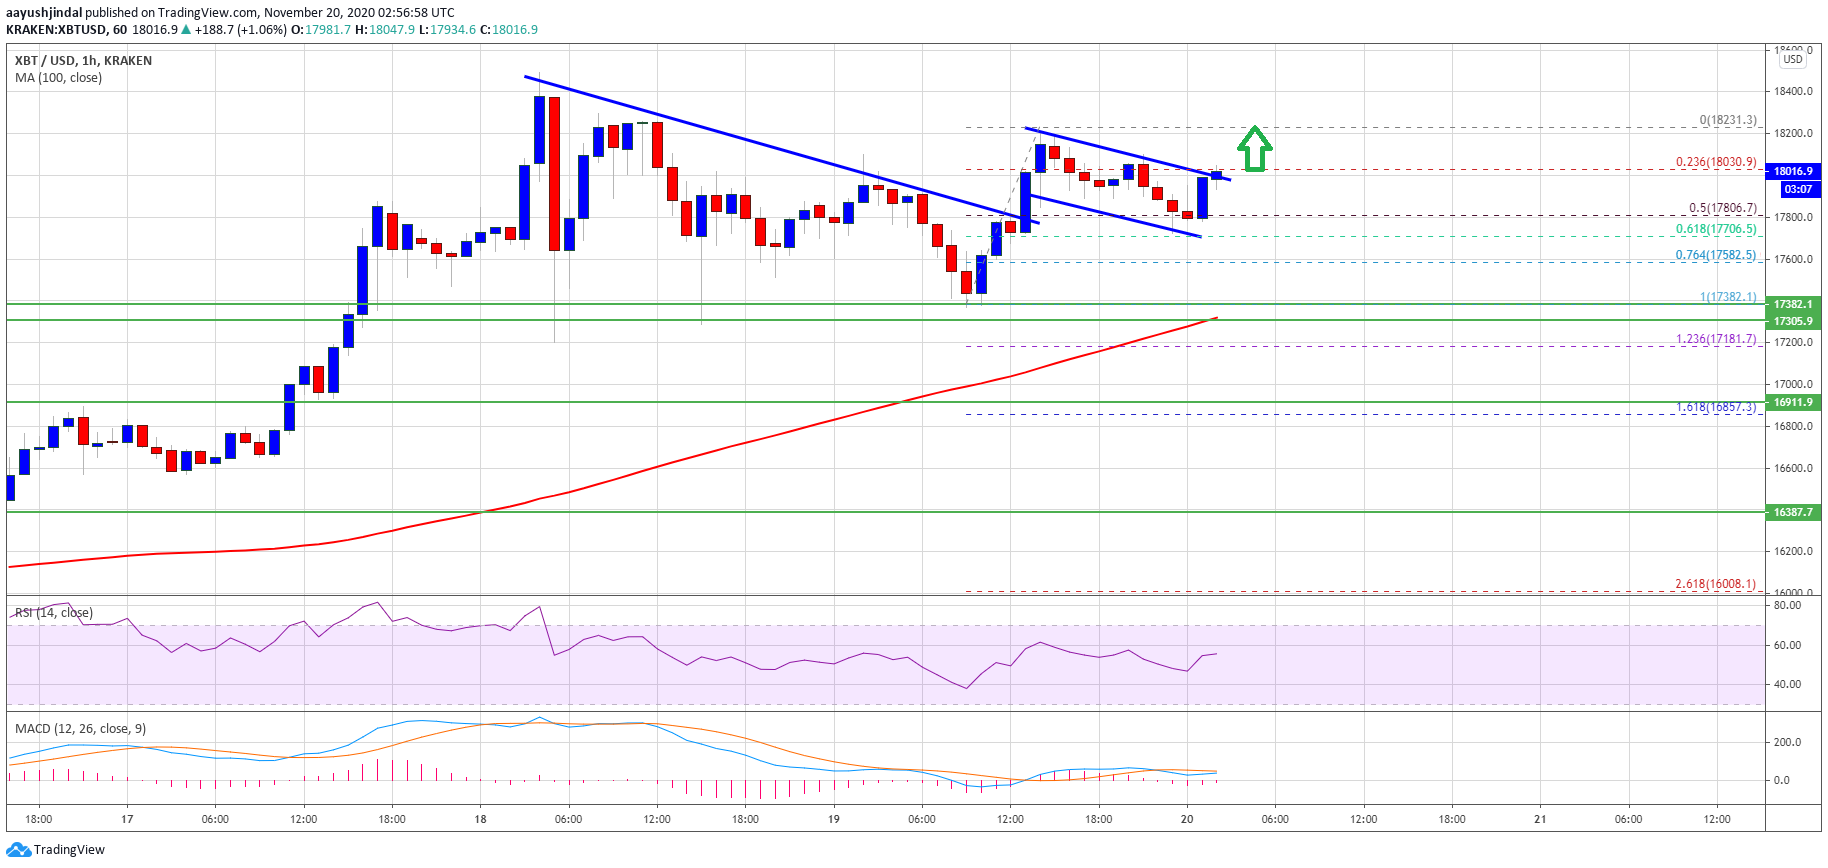
- Bitcoin formed a support base near the $17,380 level and climbed higher.
- The price is now well above the $17,500 level and the 100 hourly simple moving average.
- There was a break above a major bearish trend line with resistance near $17,800 on the hourly chart of the BTC/USD pair (data feed from Kraken).
- The pair could gain bullish momentum if there is a close above $18,150 and $18,200.
Bitcoin Price is Showing Bullish Signs
There was another drop in bitcoin price below the $17,600 and $17,500 levels. However, BTC remained stable and it seems like there is a strong support base forming near the $17,380 level.
The recent low was near $17,382 before the price started an upward move. It broke the $17,500 and $17,600 levels. There was also a break above the $17,800 level and bitcoin price settled well above the 100 hourly simple moving average.
More importantly, there was a break above a major bearish trend line with resistance near $17,800 on the hourly chart of the BTC/USD pair. The pair even spiked above $18,000, but it struggled to clear the $18,200 resistance.
Source: BTCUSD on TradingView.com
A high is formed near $18,231 and the price is currently consolidating. It corrected below the 23.6% Fib retracement level of the recent upward move from the $17,382 swing low to $18,231 high. Bitcoin now seems to be following a bullish flag pattern with resistance near the $18,030 level.
A successful break above the $18,030 level could lead the price towards the $18,200 resistance. To start a strong rally, the price must settle nicely above the $18,200 resistance level. In the stated case, the price may perhaps clear the $18,500 resistance and rally towards $19,000.
Dips Supported in BTC?
If bitcoin fails to gain strength, it could test the $17,800 support. The 50% Fib retracement level of the recent upward move from the $17,382 swing low to $18,231 high is also near the $17,800 level.
The first major support sits near the $17,500 level. The main support is now forming near the $17,380 level, below which there is a risk of a larger decline in the coming sessions.
Technical indicators:
Hourly MACD – The MACD is slowly gaining momentum in the bullish zone.
Hourly RSI (Relative Strength Index) – The RSI for BTC/USD is currently above the 50 level.
Major Support Levels – $17,800, followed by $17,500.
Major Resistance Levels – $18,030, $18,200 and $18,500.