
Bitcoin price is down over 2% and it faced another rejection below $11,000 against the US Dollar. BTC remains at a risk of more losses below $10,350 and $10,250.
- Bitcoin is failed again to clear the main $10,950 and $11,000 resistance levels.
- The price is down over 2%, and it is trading below the $10,700 level and the 100 hourly simple moving average.
- There was a break below a major bullish trend line with support at $10,690 on the hourly chart of the BTC/USD pair (data feed from Kraken).
- The pair is currently correcting losses, but it could resume its decline below $10,500.
Bitcoin Price Turns Red
Yesterday, we saw a steady increase in bitcoin price above the $10,800 level against the US Dollar. BTC price even climbed above the $10,900 level and the 100 hourly simple moving average.
However, the bulls failed to gain strength and there was no upside break above $11,000. As a result, there was a fresh bearish reaction and the price declined sharply below the $10,800 support.
There was also a break below a major bullish trend line with support at $10,690 on the hourly chart of the BTC/USD pair. The pair declined below the $10,500 level and settled well below the 100 hourly simple moving average.
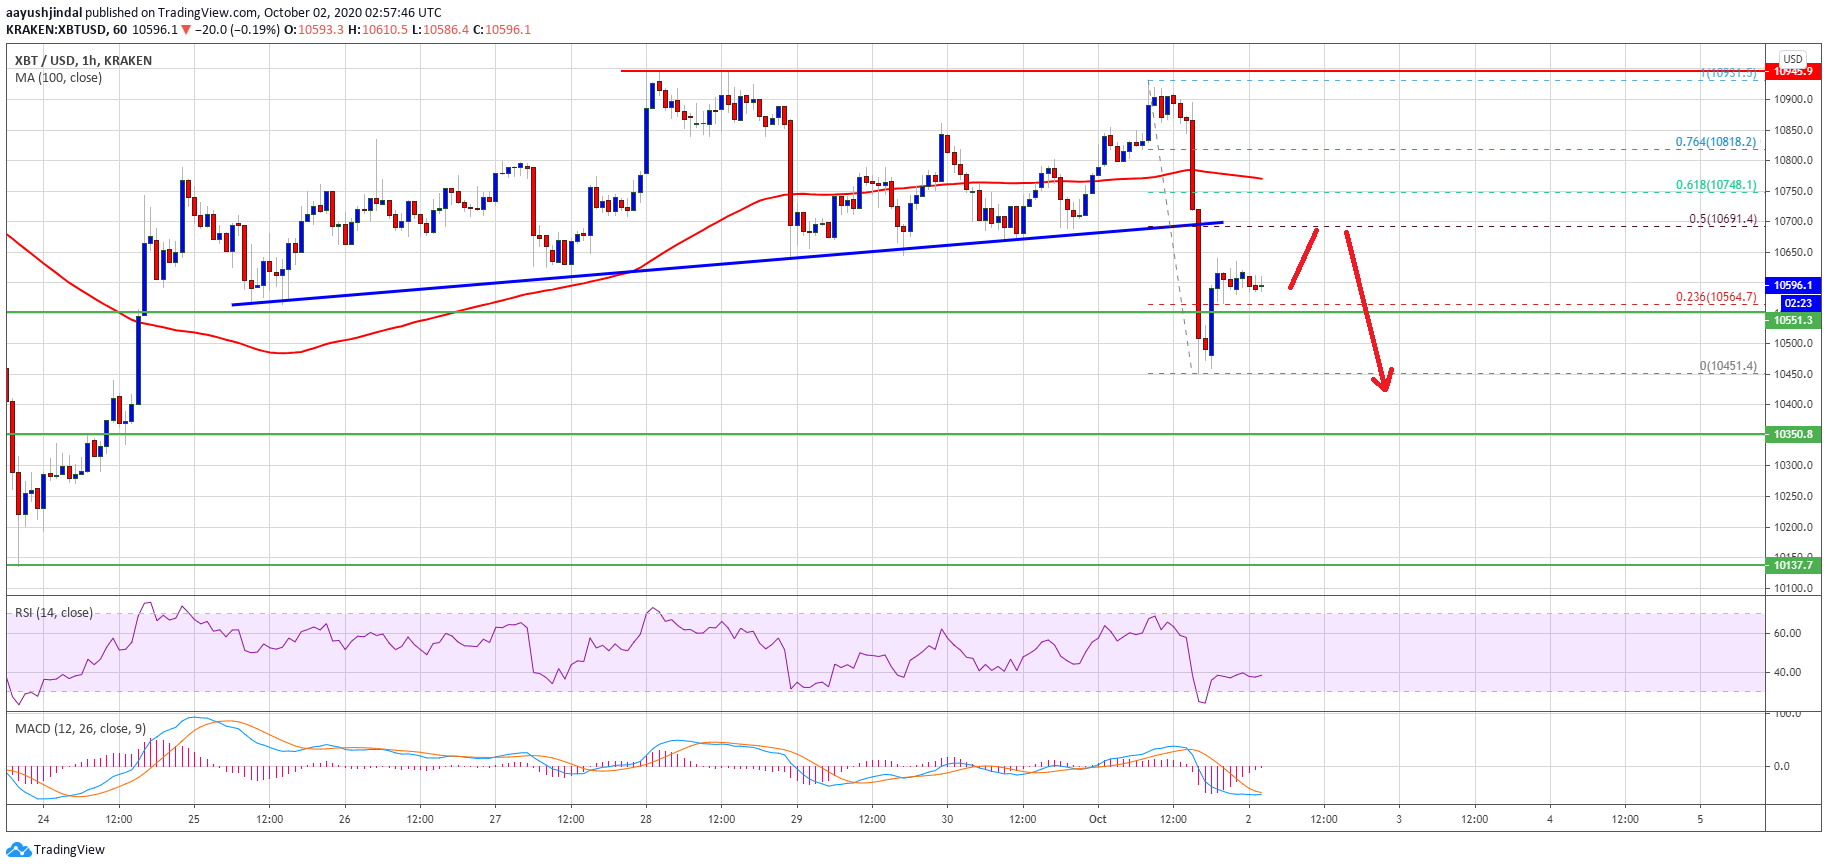
Bitcoin price dives below $10,800. Source: TradingView.com
A low is formed near $10,451 and the price is currently correcting higher. It broke the $10,550 level, plus the 23.6% Fib retracement level of the recent decline from the $10,931 high to $10,451 low.
The first key resistance on the upside is near the broken trend line at $10,700. It is close to the 50% Fib retracement level of the recent decline from the $10,931 high to $10,451 low. The next key resistance is near the $10,800 level, above which the bulls might attempt another upside break at $11,000.
More Losses in BTC?
If bitcoin fails to recover above the $10,650 and $10,700 levels, there are high chances of more downsides in the near term. An initial support is near the $10,451 low.
The first major support is near the $10,350 level, below which the price could slide towards the main support at $10,250. Any further losses may perhaps call for a test of $10,000.
Technical indicators:
Hourly MACD – The MACD is showing a few signs of recovery in the bearish zone.
Hourly RSI (Relative Strength Index) – The RSI for BTC/USD is currently near the 40 level.
Major Support Levels – $10,450, followed by $10,250.
Major Resistance Levels – $10,700, $10,800 and $11,000.