
Cardano’s price is holding the $0.0950 support level and recovering higher. However, ADA must surpass $0.1020 and $0.1040 to start a fresh rally in the near term.
- ADA traded as high as $0.1129 before declining below the $0.1050 support against the US dollar.
- The price is holding the $0.0950 support, but it is well below the 100 simple moving average (4-hours).
- There is a key bearish trend line forming with resistance near $0.1020 on the 4-hours chart of the ADA/USD pair (data source from Bitfinex).
- The pair is likely to start a fresh rally if there is a clear break above $0.1020 and $0.1040.
Cardano (ADA) is Facing Hurdles
After struggling to stay above the $0.1125 pivot level, cardano’s price started a fresh decline. ADA broke the $0.1100 and $0.1050 support levels to move into a bearish zone.
There was also close below the $0.1050 level and the 100 simple moving average (4-hours). The price even broke the $0.1000 support level and a low is formed near $0.0952. It is currently correcting higher and trading above the $0.1000 level.
There was a break above the 23.6% Fib retracement level of the recent decline from the $0.1129 high to $0.0952 low. An initial resistance is near the $0.1015 and $0.1020 levels.
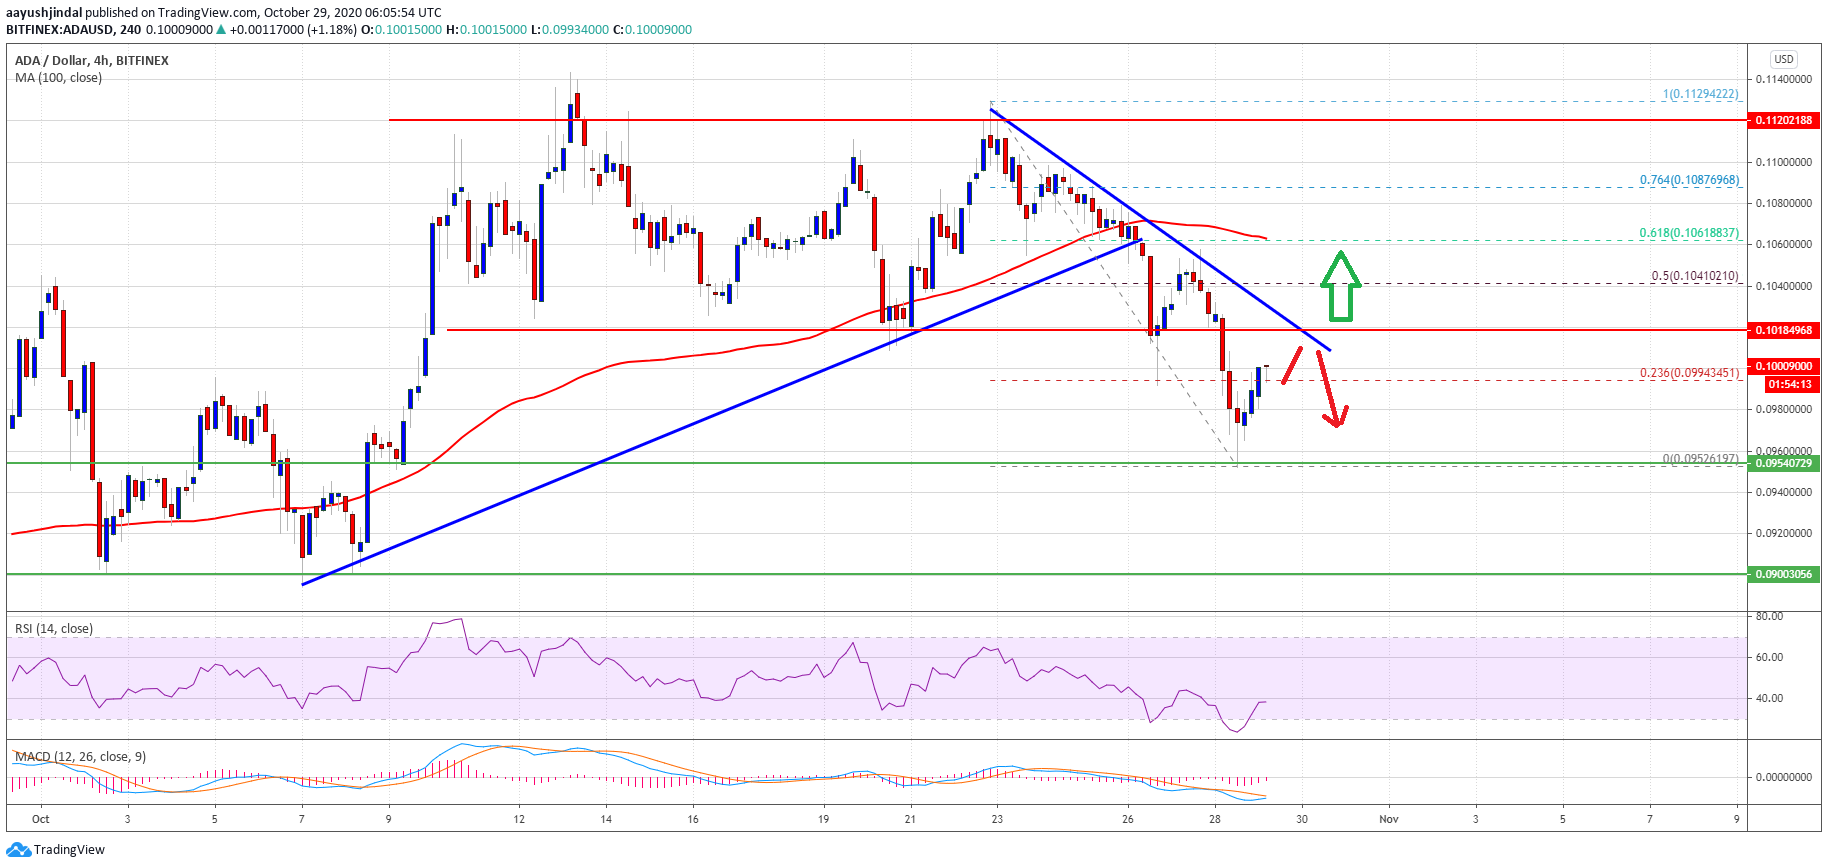
Source: ADAUSD on TradingView.com
There is also a key bearish trend line forming with resistance near $0.1020 on the 4-hours chart of the ADA/USD pair. The trend line resistance is important near $0.1020 since it represents the previous breakdown zone. The next major resistance is near the $0.1040 level.
The 50% Fib retracement level of the recent decline from the $0.1129 high to $0.0952 low is also near the $0.1040 level to act as a hurdle. A clear break above $0.1020 and $0.1040 is needed to start a fresh increase. The next major resistance is at $0.1060, followed by $0.1120.
Limited Downsides?
If cardano’s price fails to clear the $0.1020 and $0.1040 resistance levels, there is a risk of a fresh decline. An initial support is near the $0.0980 level.
The main support is still near the $0.0950 level, below which the price could accelerate lower. The next key support is near the $0.0900 level.
Technical Indicators
Daily MACD – The MACD for ADA/USD is struggling to move into the bullish zone.
Daily RSI (Relative Strength Index) – The RSI for ADA/USD is currently recovering, but it is still below the 40 level.
Major Support Levels – $0.0980, $0.0950 and $0.0900.
Major Resistance Levels – $0.1020, $0.1040 and $0.1060.