
Cardano’s price started a strong surge over $0.2000, similar to bitcoin. ADA is showing positive signs and it is likely to continue higher above $0.2800 and $0.3000.
- ADA started a strong surge above the $0.2000 and $0.2400 resistance levels against the US dollar.
- The price is now trading well above $0.2600 and the 100 simple moving average (4-hours).
- There was a break above a key contracting triangle with resistance near $0.2280 on the 4-hours chart of the ADA/USD pair (data source from Bitfinex).
- The pair is likely to continue higher above $0.2800 and $0.2850 in the coming sessions.
Cardano (ADA) is Surging
In the past few days, cardano’s price started a strong increase after it settled above $0.2000. ADA price rallied significantly and it broke many important hurdles near $0.2250 and $0.2300.
There was also was a break above a key contracting triangle with resistance near $0.2280 on the 4-hours chart of the ADA/USD pair. It opened the doors for more gains above the $0.2500 level and the price settled well above the 100 simple moving average (4-hours).
The price even traded above the $0.2650 level and traded to a new multi-week high at $0.2751. It is currently consolidating gains above the $0.2500 and $0.2600 levels. An initial support on the downside is near the $0.2550 level.
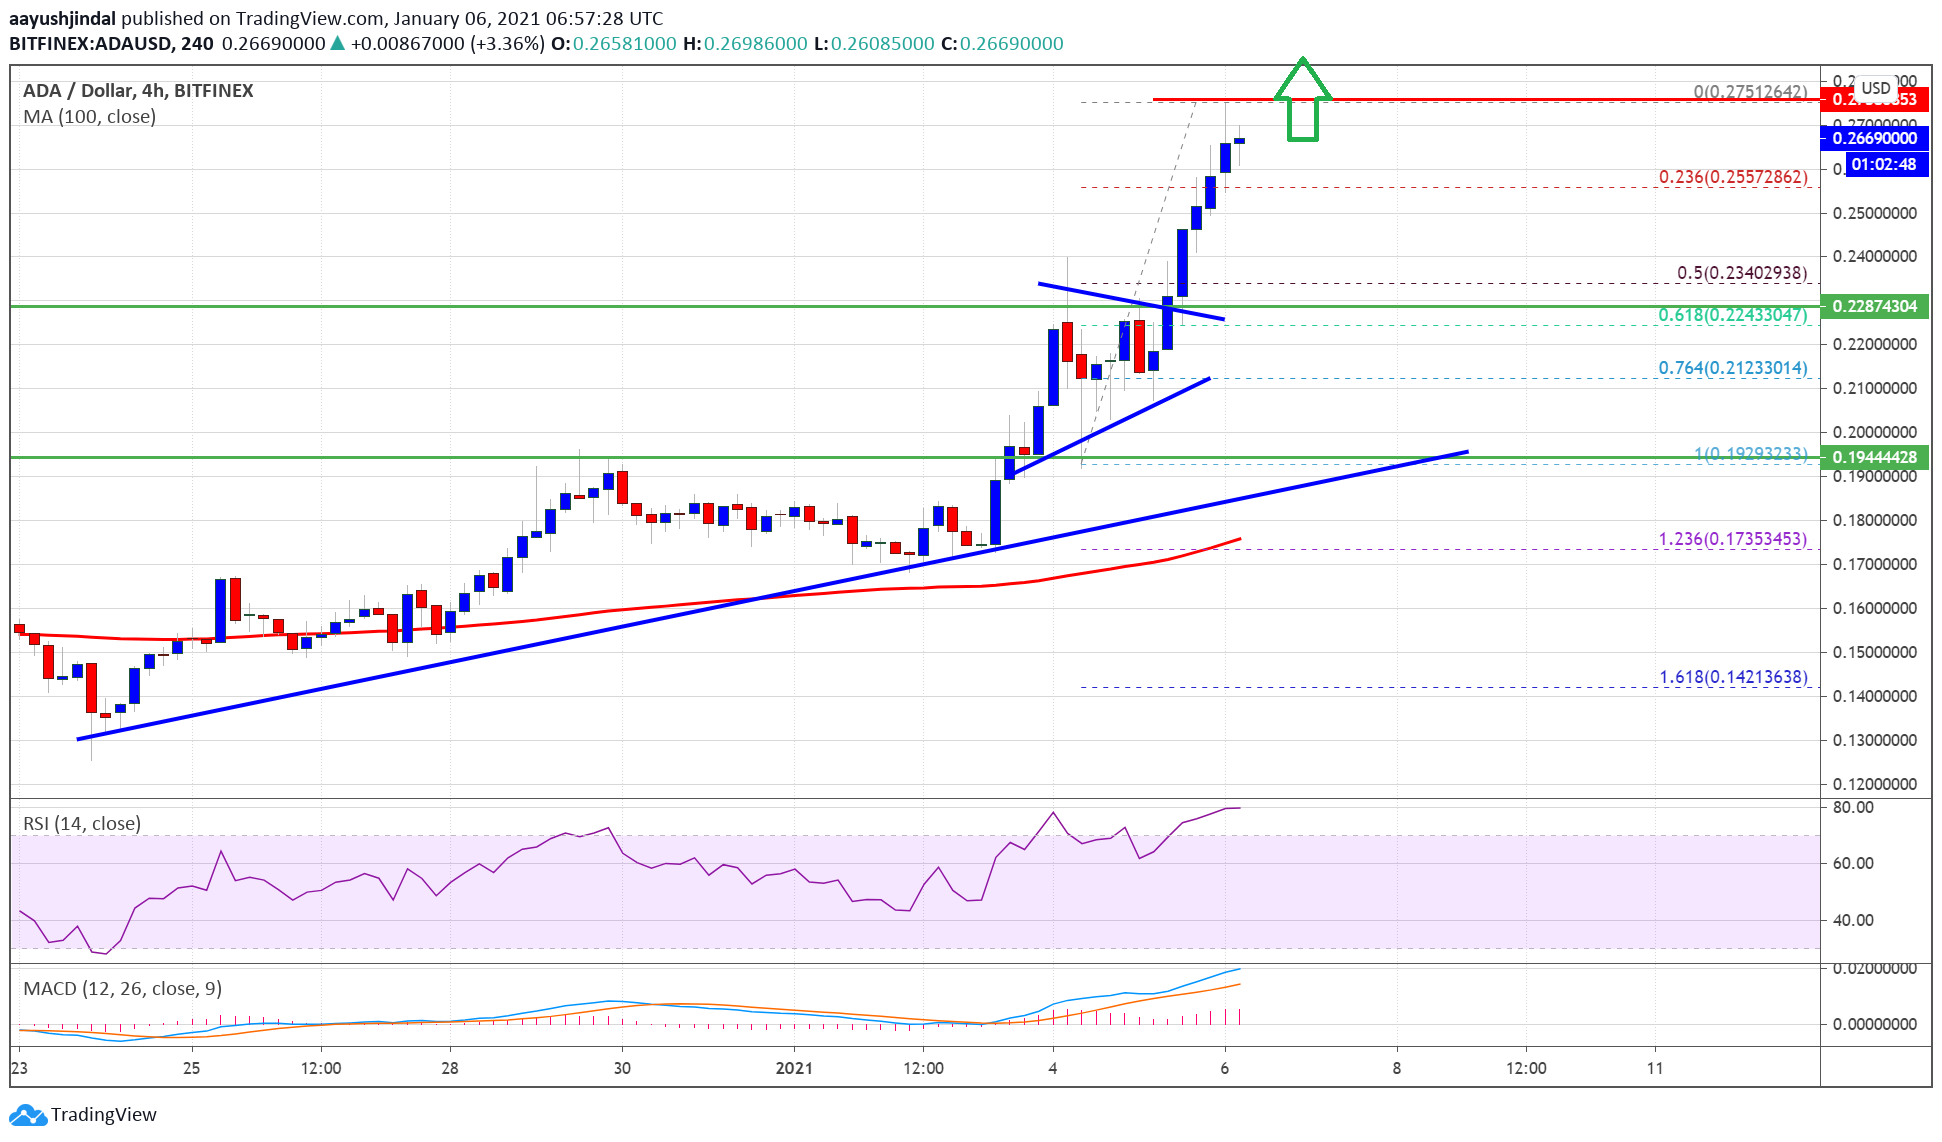
Source: ADAUSD on TradingView.com
It is close to the 23.6% Fib retracement level of the recent upward move from the $0.1929 swing low to $0.2751 high. On the upside, the price is likely to face resistance near $0.2750.
A close above the recent high could open the doors for more gains above $0.2800 and $0.2850. The next major resistance on the upside is seen near the $0.3000 level.
Dips Supported?
If cardano’s price fails to clear the $0.2750 and $0.2800 resistance levels, it could correct lower. An initial support is near the $0.2500 level.
The main support is now forming near the $0.2350 level. It is close to the 50% Fib retracement level of the recent upward move from the $0.1929 swing low to $0.2751 high. There is also a connecting bullish trend line forming with support near $0.2000 on the same chart.
Technical Indicators
4-hours MACD – The MACD for ADA/USD is clearly gaining strong pace in the bullish zone.
4-hours RSI (Relative Strength Index) – The RSI for ADA/USD is currently in the overbought zone.
Major Support Levels – $0.2550, $0.2500 and $0.2350.
Major Resistance Levels – $0.2750, $0.2800 and $0.3000.