
Chainlink (LINK) started a sharp rise from the $10.00 support zone. It traded as high as $13.64, corrected lower, and now it is likely preparing for another leg higher over $13.00.
- Chainlink token price started a major upward move after it cleared the $11.50 resistance against the US dollar.
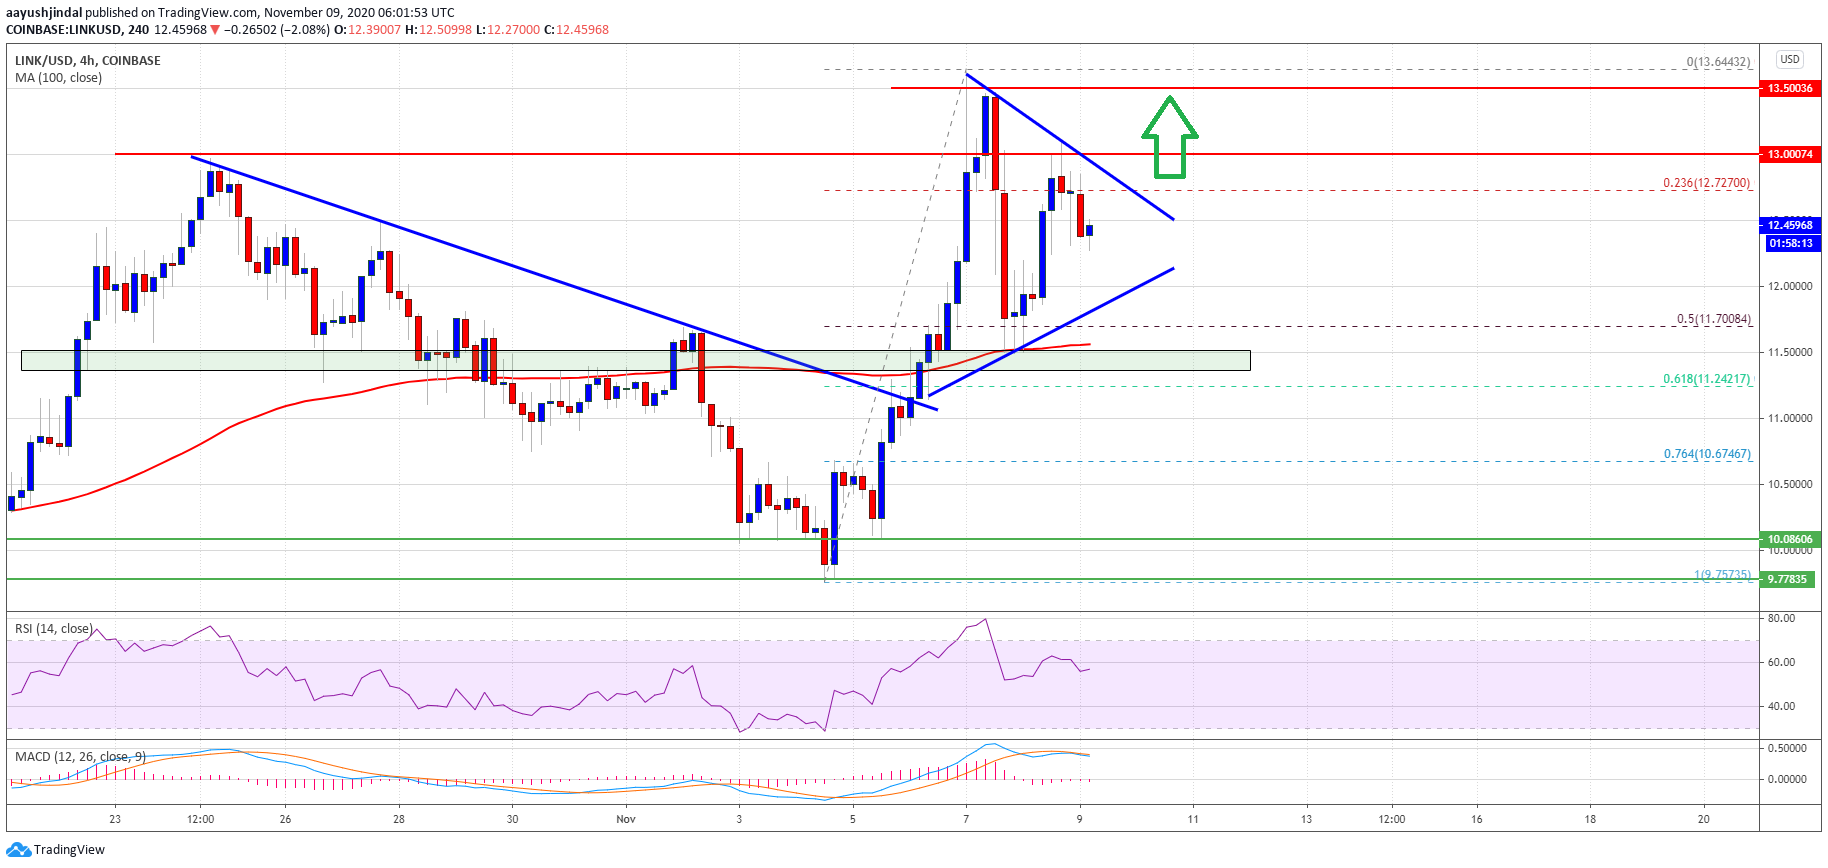
- The price traded as high as $13.64 and settled well above the 100 simple moving average (4-hours).
- There is a key contracting triangle forming with resistance near $12.70 on the 4-hours chart of the LINK/USD pair (data source from Kraken).
- The current price action indicates chances of a fresh rally above $12.70 and $13.00.
Chainlink (LINK) Signaling More Upsides
This past week, chainlink (LINK) formed a strong support base near $9.80 and $10.00. The price started a strong upward move (similar to bitcoin) and cleared the $11.00 resistance zone to move into a positive zone.
The bulls gained pace above the $11.50 resistance and the 100 simple moving average (4-hours). There was a break above the $13.00 resistance and the price traded to a new monthly high at $13.64.
Recently, there was a sharp downside correction below the $13.00 and $12.50 levels. The price traded below the 23.6% Fib retracement level of the upward move from the $9.75 swing low to $13.64 high. There was also a spike below $12.00, but the bulls defended the $11.80 support zone.
Source: LINKUSD on TradingView.com
The 100 simple moving average (4-hours), and the 50% Fib retracement level of the upward move from the $9.75 swing low to $13.64 high are also acting as strong supports.
It seems like there is a key contracting triangle forming with resistance near $12.70 on the 4-hours chart of the LINK/USD pair. If the pair breaks the triangle resistance, it is likely to start a fresh increase above the $13.00 resistance.
The next major resistance is near the $13.50 and $13.65 levels. Any further gains could lead the price towards the $14.00 resistance zone.
Downsides Limited?
An initial support for chainlink’s price is near the triangle lower trend line at $12.00. If there is a downside break below the triangle support, the price could revisit the $11.50 support.
The 100 simple moving average (4-hours) and the $11.50 support are very important. A clear close below $11.50 might push the price towards the $10.50 support zone.
Technical Indicators
4-hours MACD – The MACD for LINK/USD is likely to move back into the bullish zone.
4-hours RSI (Relative Strength Index) – The RSI for LINK/USD is still well above the 50 level.
Major Support Levels – $12.00, $11.60 and $11.50.
Major Resistance Levels – $12.70, $13.00 and $13.65.