
Chainlink (LINK) started a sharp decline after forming a head and shoulders pattern (as discussed in the previous analysis). The bears are gaining strength and aiming a test of $10.20.
- Chainlink token price started a fresh decline after it failed to clear the $12.50 resistance against the US dollar.
- The price is now trading below $11.20 and the 100 simple moving average (4-hours).
- There is a key declining channel forming with resistance near $11.80 on the 4-hours chart of the LINK/USD pair (data source from Kraken).
- A head and shoulders pattern triggered a sharp decline below the $11.50 support.
Chainlink (LINK) Price Dives 10%
In my last technical analysis, we saw a potential head and shoulders pattern for chainlink (LINK) with resistance near the $12.50 zone. The price did form the right shoulder near $12.50 and started a fresh decline (unlike bitcoin).
There was a sharp decline after the price broke the neckline support zone at $11.60. It sparked a sharp decline below the $11.50 and $11.40 support levels. There was a break below the 50% Fib retracement level of the upward move from the $9.80 swing low to $12.97 high.
The price even settled below the $11.20 support and the 100 simple moving average (4-hours). It is now trading just below the $11.00 support level and testing the 61.8% Fib retracement level of the upward move from the $9.80 swing low to $12.97 high.
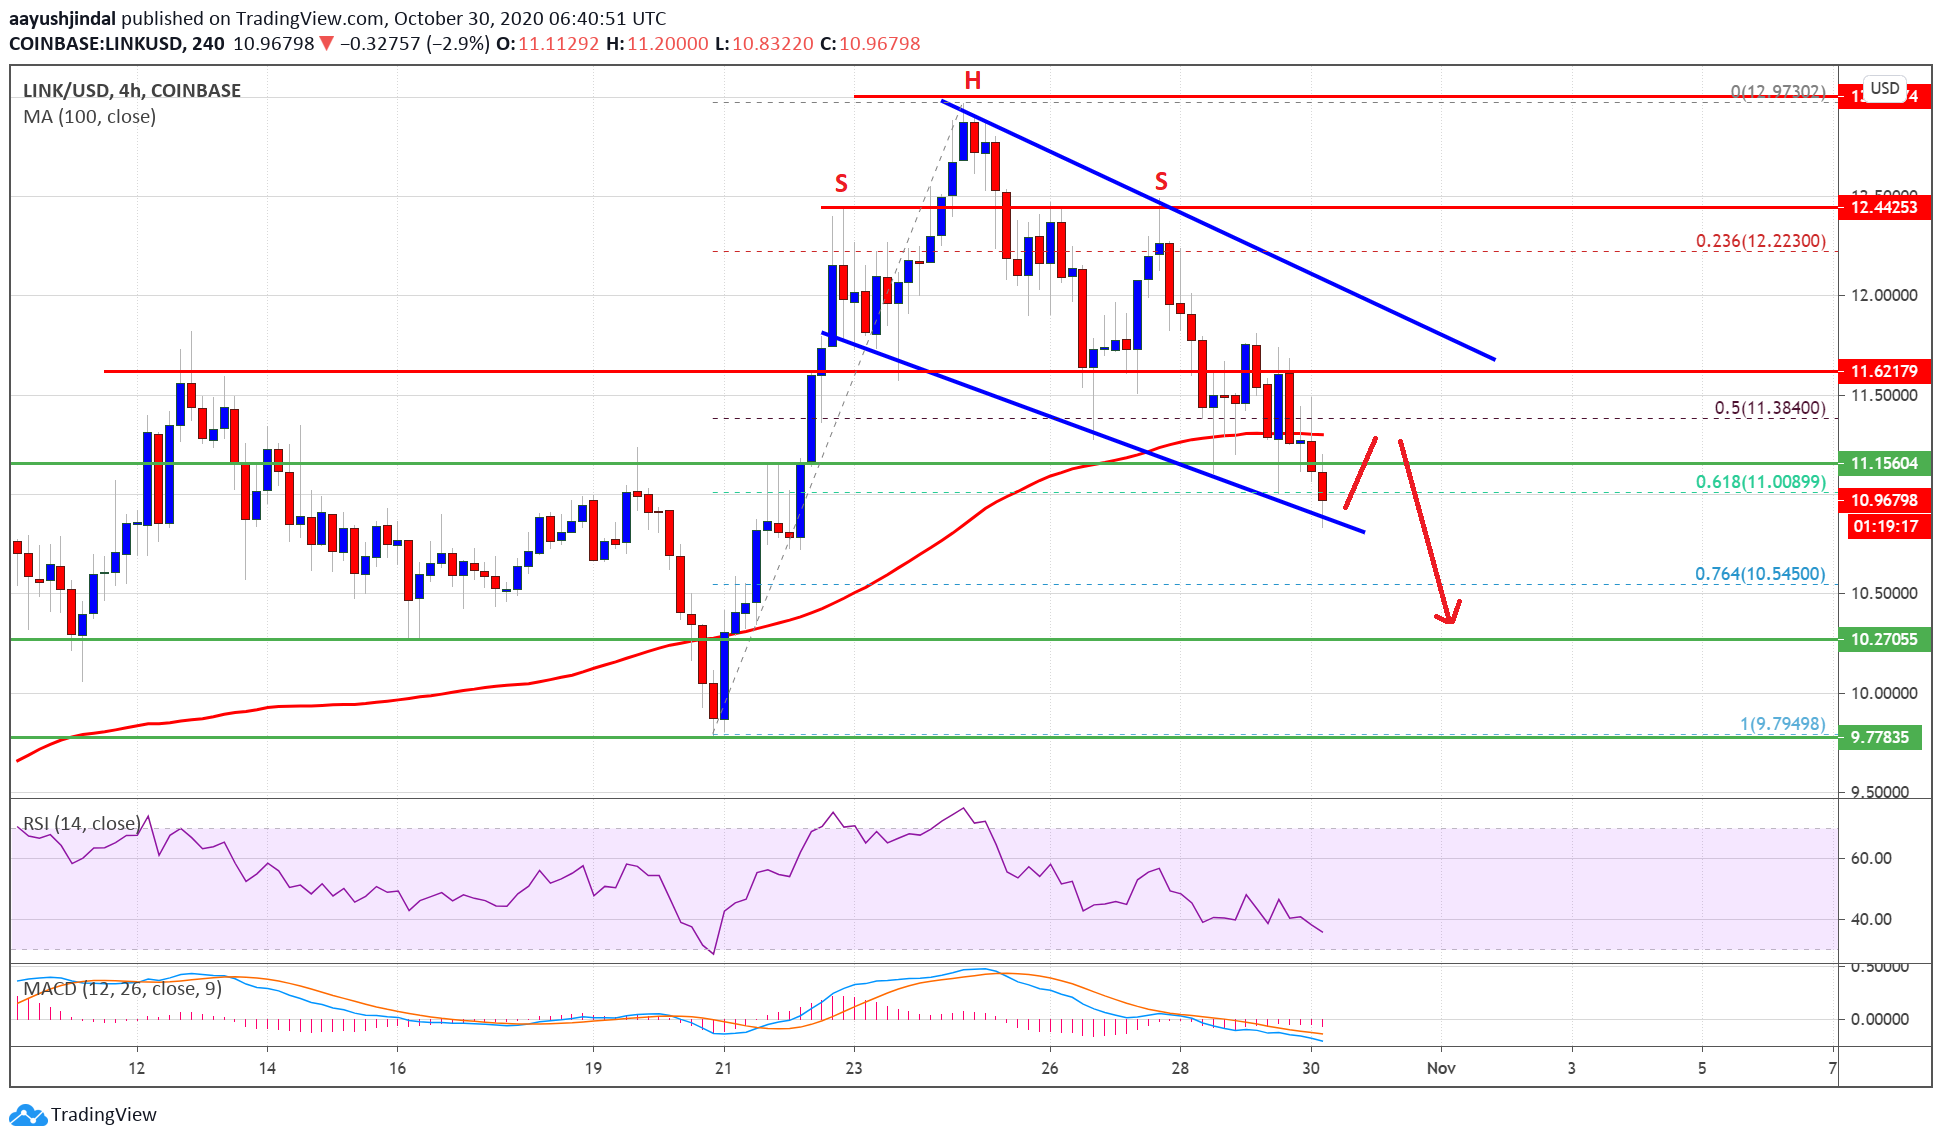
Source: LINKUSD on TradingView.com
There is also a key declining channel forming with resistance near $11.80 on the 4-hours chart of the LINK/USD pair. If there is a downside break below the channel support at $10.85, there is a risk of more losses.
The next major support is near the $10.50 level, below which the bears are likely to aim a test of the $10.20 support zone or even $10.00.
Upsides Capped?
If chainlink’s price starts a corrective increase, it could climb above the $11.20 resistance. The first key resistance on the upside is near the $11.40 level.
The next major resistance on the upside is near the $11.60 level and the channel trend line. A successful close above the $11.60 level might open the doors for a push towards the $12.00 resistance.
Technical Indicators
4-hours MACD – The MACD for LINK/USD is gaining pace in the bearish zone.
4-hours RSI (Relative Strength Index) – The RSI for LINK/USD is now well below the 50 level.
Major Support Levels – $10.85, $10.50 and $10.20.
Major Resistance Levels – $11.20, $11.60 and $12.00.