
Chainlink (LINK) started a strong rally after a major correction towards the $9.80 level. The price is up over 20% and it is likely to continue higher above the $12.50 resistance.
- Chainlink token price is surging and it recently broke the $12.00 resistance against the US dollar.
- The price is still trading well above $11.80 and the 100 simple moving average (4-hours).
- There was a break above a crucial declining channel with resistance near $11.00 on the 4-hours chart of the LINK/USD pair (data source from Kraken).
- The pair is consolidating gains, but it is likely to continue higher above the $12.50 resistance level.
Chainlink (LINK) Price Turns Green
After a major downside correction (as discussed in the previous analysis), chainlink (LINK) found support near the $9.80 level. A low was formed near $9.79 before the price started a strong upward move.
Bitcoin and ether gained traction in the past few sessions, resulting in a strong rally in altcoins such as litecoin, ripple, LINK, and bitcoin cash. LINK gained over 20% and it broke many hurdles near $10.00 and $11.00.
The recent increase was initiated after there was a break above a crucial declining channel with resistance near $11.00 on the 4-hours chart of the LINK/USD pair. The pair broke the main $11.50 resistance and settled above the 100 simple moving average (4-hours).
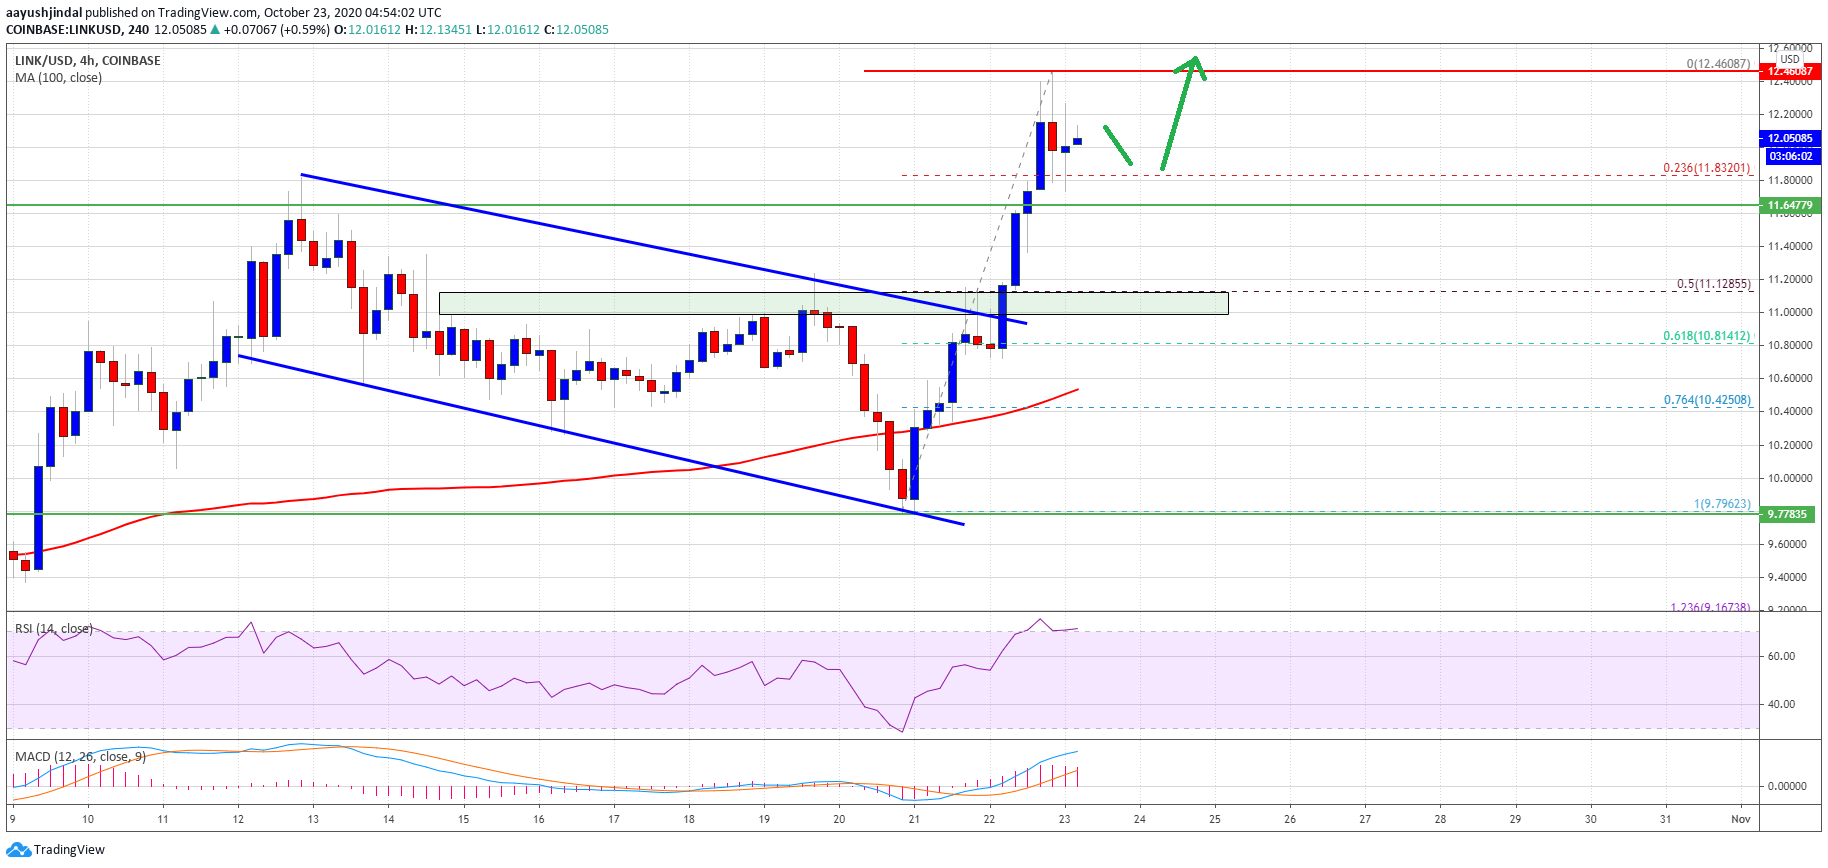
Source: LINKUSD on TradingView.com
It surged above the $12.00 resistance and traded to a new monthly high near the $12.46 level. The price is currently correcting lower and trading below $12.20. There was a test of the 23.6% Fib retracement level of the recent rally from the $9.79 low to $12.46 high.
The next major support is near the $11.85 and $11.65 levels, below which the bears might aim a test of the 50% Fib retracement level of the recent rally from the $9.79 low to $12.46 high.
On the upside, an initial resistance is near the $12.20 level. The first major hurdle is near the $12.50 level, above which the price could rally towards the $13.20 level.
Downside Correction?
If chainlink’s price starts a downside correction below the $11.80 support, there are chances of an extended decline in the coming sessions.
The next major support is near the $11.20 level, below which the bears are likely to aim a test of the 100 simple moving average (4-hours) at $10.60 in the coming days.
Technical Indicators
4-hours MACD – The MACD for LINK/USD is now gaining pace in the bullish zone.
4-hours RSI (Relative Strength Index) – The RSI for LINK/USD is now well above the 65 level.
Major Support Levels – $11.80, $11.65 and $11.20.
Major Resistance Levels – $12.20, $12.50 and $13.20.