
Like other altcoins, Chainlink (LINK) has been subject to a strong correction over recent weeks. The coin now trades at $10 as of this article’s writing, around 50% below the all-time highs set at approximately $20 just weeks ago.
Despite the strong drop, analysts remain optimstic about LINK’s price prospects.
Related Reading: Ethereum Transaction Fees Surge to All-Time Highs After Uniswap Launch
This Analyst Thinks Chainlink Will Soon Move Above $20
The cryptocurrency trader who predicted that Bitcoin would undergo a V-shaped reversal to $10,000 at the March lows is now optimistic about LINK’s prospects.
Referencing the chart below, he commented:
“Stinkbids on $LINK at $8-9 and accumulating some now around $10. Invalidation if price starts fucking around below stinkbids & will build more size if trend confirms. I think this is going to $28-32 on the next run. $BTC pair also looks ready to turn around soonish.”
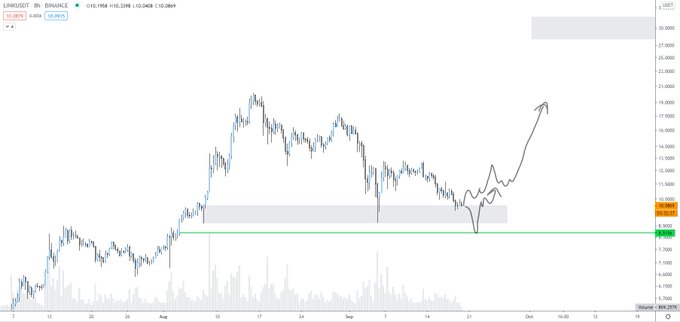
Chart of LINK's price action over the past few weeks with analysis by crypto trader Bitcoin Jack. Chart from TradingView.com
He isn’t the only bull.
Michael Van De Poppe, a crypto analyst and trader at the Amsterdam Stock Exchange, recently shared the chart below in an attempt to show where Chainlink is likely to move next:
“The higher timeframe levels are quite clear on LINK. Lower timeframe potential entry zones are approaching with the potential of bouncing towards $12. Breaking $12 and $13-13.50 is on the horizon,” he said in reference to the chart below.

Image Courtesy of Crypto Michael. Chart via TradingView.
Both charts show that LINK is on the verge of catching a bid as it reaches historically important support levels.
Related Reading: Critical On-Chain Signal Predicts That Bitcoin’s Next Move Will Be Upward
Dependent on Bitcoin
While Chainlink has its own technical merits and its own fundamentals, LINK’s price action is ultimately dependent on that of Bitcoin. The leading cryptocurrency, of course, dictates the macro trajectory of the digital asset and blockchain space.
Bitcoin is fortunately on decent grounds on a technical and on-chain perspective.
As reported by NewsBTC, an analyst identified that Bitcoin’s “moving losses” metric is now outpacing “moving profits.” Referencing the chart below, he wrote:
“So when the red lines goes above the green line it means we entered bullish territory because at that point there are more people selling at a loss than for profit –> lots of rekt people. This is how bottoms form. The higher the red line, the better.”

Chart of BTC's price action over the past year or so with moving profits and losses indicator from WhaleMap, shared by trader Byzantine General
He explained that more Bitcoin traders are in the red than there are in the green, decreasing selling pressure, thus increasing the chance at upward price action.
Related Reading: MicroStrategy’s Stock Continues to Soar After Bitcoin Purchase
Featured Image from Shutterstock
PRice tags: linkusd, linkbtc
Charts from TradingView.com
Historically Accurate Analyst: Chainlink (LINK) Will Soon Move Above $20