
Ethereum is slowly rising and trading above the $460 resistance against the US Dollar. ETH price is likely to rally towards $495 or $500 if it clears the $470 resistance zone.
- Ethereum is showing positive signs above the $450 and $455 support levels.
- The price is currently trading above the $460 resistance and well above the 100 hourly simple moving average.
- There is a major bullish trend line forming with support near $444 on the hourly chart of ETH/USD (data feed via Kraken).
- The pair could start a strong rally if there is a clear break above the $470 resistance zone.
Ethereum Price is Likely To Surge Again
After forming a support base above $440, Ethereum started a steady rise. ETH price broke the $450 and $455 resistance levels to move into a positive zone.
The upward move was such that the price climbed above the key $460 resistance, plus settled well above the 100 hourly simple moving average. A swing high was formed near $467 and the price is currently consolidating gains.
An initial support is near the $460 zone (a multi-touch zone). It is also close to the 23.6% Fib retracement level of the recent upward move from the $441 swing low to $467 high. The first key support is near the $455 level, where the bulls are likely to emerge.
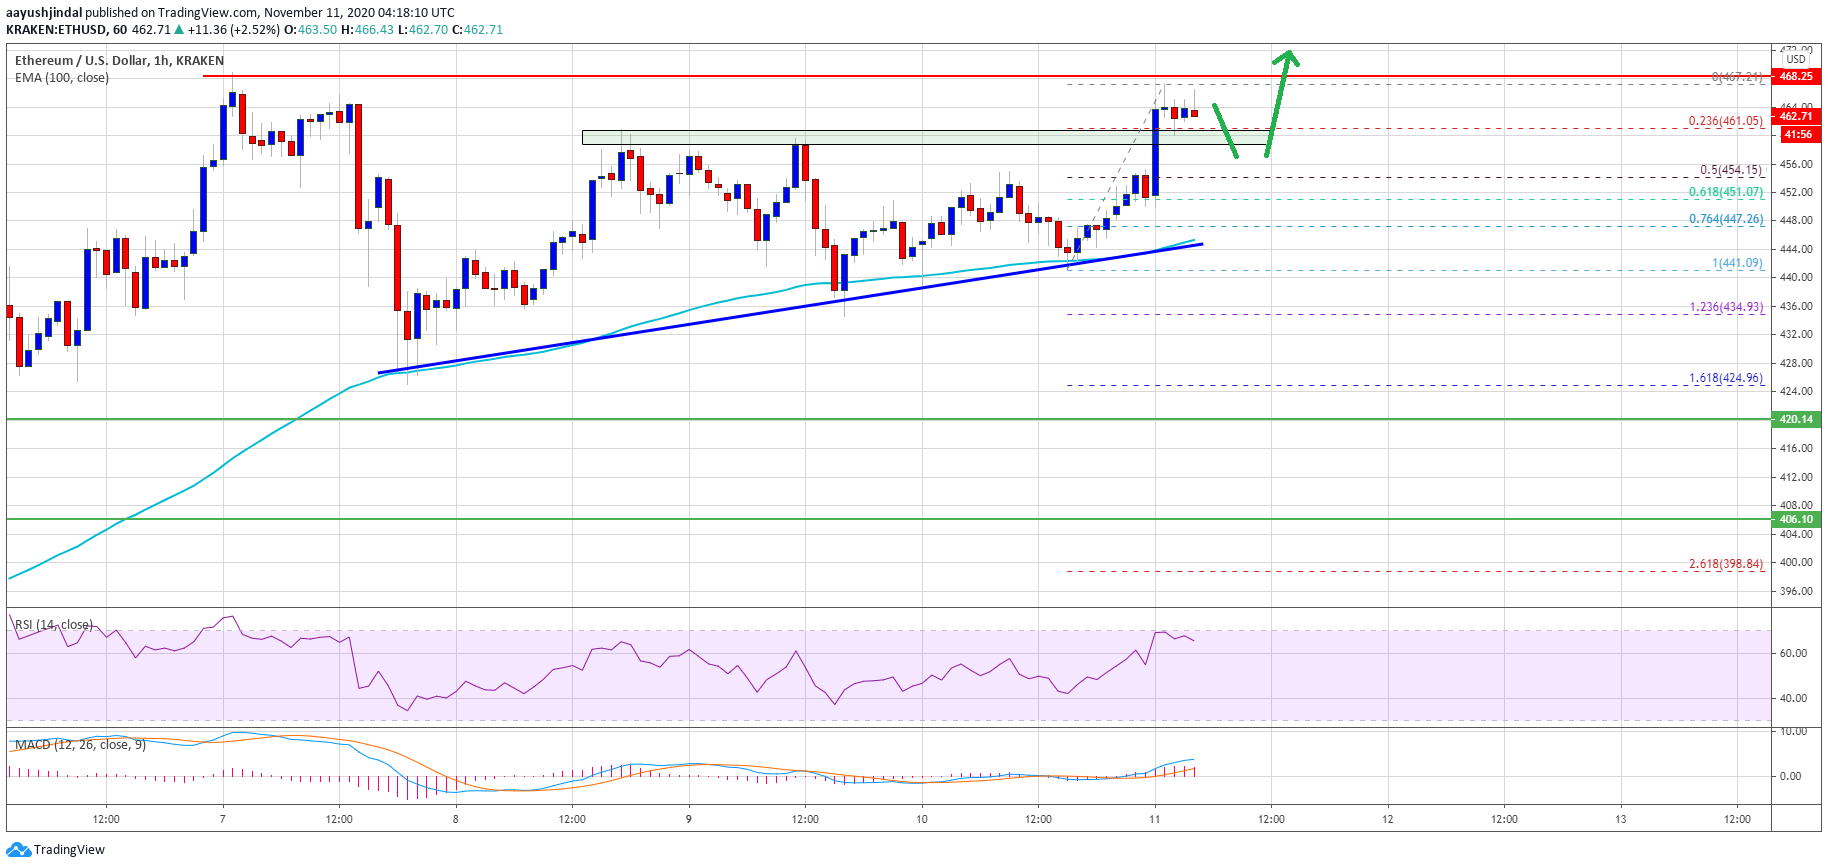
Source: ETHUSD on TradingView.com
The 50% Fib retracement level of the recent upward move from the $441 swing low to $467 high is also near the $455 level. There is also a major bullish trend line forming with support near $444 on the hourly chart of ETH/USD.
On the upside, the $468 and $470 levels are important barriers. A successful close above the $470 resistance level might open the doors for a sharp increase. The next key resistance is seen near the $480 level. Any further gains might call for a move towards the $495 and $500 levels.
Downsides Supported in ETH?
There are many supports forming for Ethereum, starting with $460. The first key support is near the $455 level. The main support is forming near the trend line, $445 and the 100 hourly SMA.
A clear break below the $444 support level might negate the current bullish view. Any further losses may perhaps open the gates for a drop towards the $420 support zone.
Technical Indicators
Hourly MACD – The MACD for ETH/USD is slowly losing momentum in the bullish zone.
Hourly RSI – The RSI for ETH/USD is now well above the 60 level.
Major Support Level – $455
Major Resistance Level – $470