
Ethereum cleared the $405 and $410 resistance levels to start a fresh rally, following bitcoin price surge against the US Dollar. ETH price is likely to continue higher towards $450 and $465.
- Ethereum is up over 6% and it broke the key $420 resistance level.
- The price is now trading above $425 and the 100 hourly simple moving average.
- There is a major bullish trend line forming with support near $420 on the hourly chart of ETH/USD (data feed via Kraken).
- The pair could correct lower, but the $420 support zone is likely to protect losses.
Ethereum Price is Following Bitcoin’s Surge
After forming a support base above the $400 level, Ethereum started a strong upward move. ETH price broke the $405 and $410 resistance levels to move into a positive zone and start the recent rally.
The price gained bullish momentum and it surged above the $420 resistance level. The upward move was such that ether even spiked above $440 and it settled well above the 100 hourly simple moving average. A new monthly high is formed near $442 and the price is currently correcting lower.
Ether is trading below the $435 support, plus it traded below the 23.6% Fib retracement level of the recent rally from the $407 swing low to $442 high. On the downside, there are many supports, starting with $424.
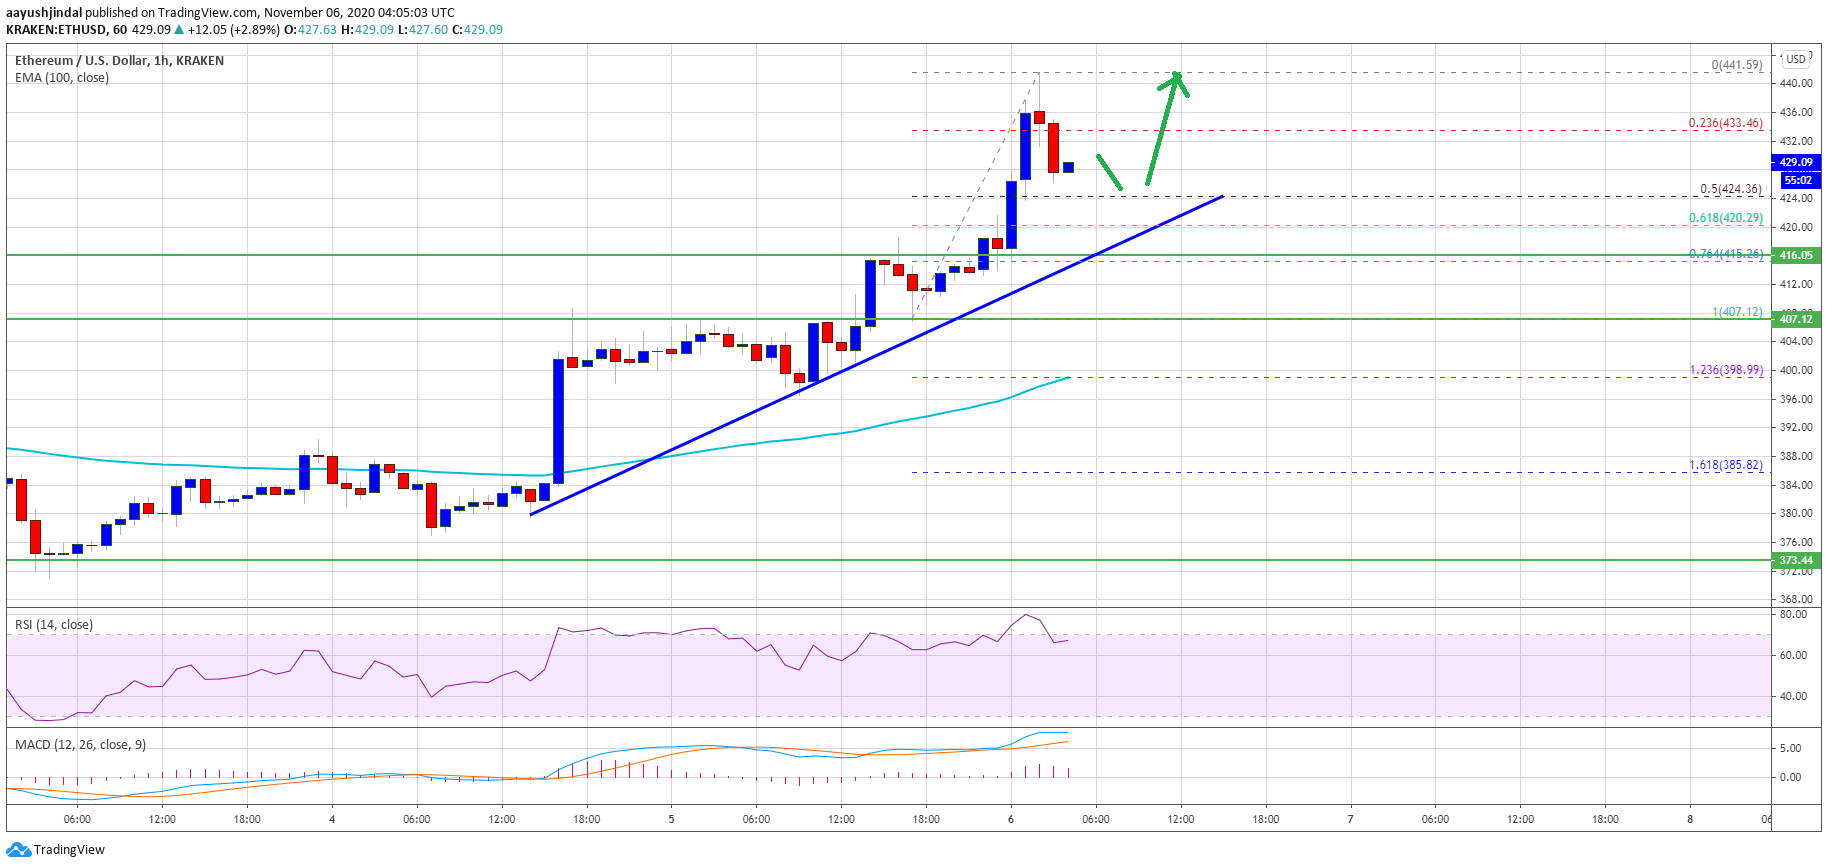
Source: ETHUSD on TradingView.com
The 50% Fib retracement level of the recent rally from the $407 swing low to $442 high is near $424 to provide support. There is also a major bullish trend line forming with support near $420 on the hourly chart of ETH/USD.
On the upside, the $435 level is an initial resistance. The first major hurdle is near $440, above which the price could easily test $450. Any further gains could lead the price towards the $465 resistance.
Downside Limited in ETH?
If Ethereum fails to clear the $435 and $440 resistance levels, it could correct lower. The first major support on the downside is near the $424 level.
The main breakdown support is forming near the trend line and $420. If ether price breaks the trend line support, it could continue to move down towards the $400 support zone or the 100 hourly simple moving average.
Technical Indicators
Hourly MACD – The MACD for ETH/USD is slowly losing momentum in the bullish zone.
Hourly RSI – The RSI for ETH/USD is still well above the 60 level.
Major Support Level – $420
Major Resistance Level – $440