
Ethereum corrected lower sharply from a new all-time high at $1,166 against the US Dollar. ETH price remained well bid near $900 and it is currently showing signs of a fresh increase.
- Ethereum rallied significantly and traded to a new all-time high at $1,160 before correcting lower.
- The price is now consolidating above $900 and it is well above the 100 hourly simple moving average.
- There is a key bullish trend line forming with support near $980 on the hourly chart of ETH/USD (data feed via Kraken).
- The pair is likely to resume higher as long as there is no close below $975 and $950.
Ethereum Price Remains Elevated
There was a strong surge in Ethereum above the $900 and $1,000 levels. ETH price broke the $1,100 level and settled well above the 100 hourly simple moving average. A new multi-month high was formed near $1,160 before the price corrected lower sharply.
There was a 20% decline in the price below $1,100. Ether price even spiked below the $1,000 and $900 levels. A low was formed near $889 before the price started a fresh increase.
The price climbed higher above the $1,000 and $1,100 levels. However, the bulls struggled to gain momentum above $1,120 and $1,130 levels. A high is formed near $1,135 and the price is again declining. It broke the $1,050 support level.
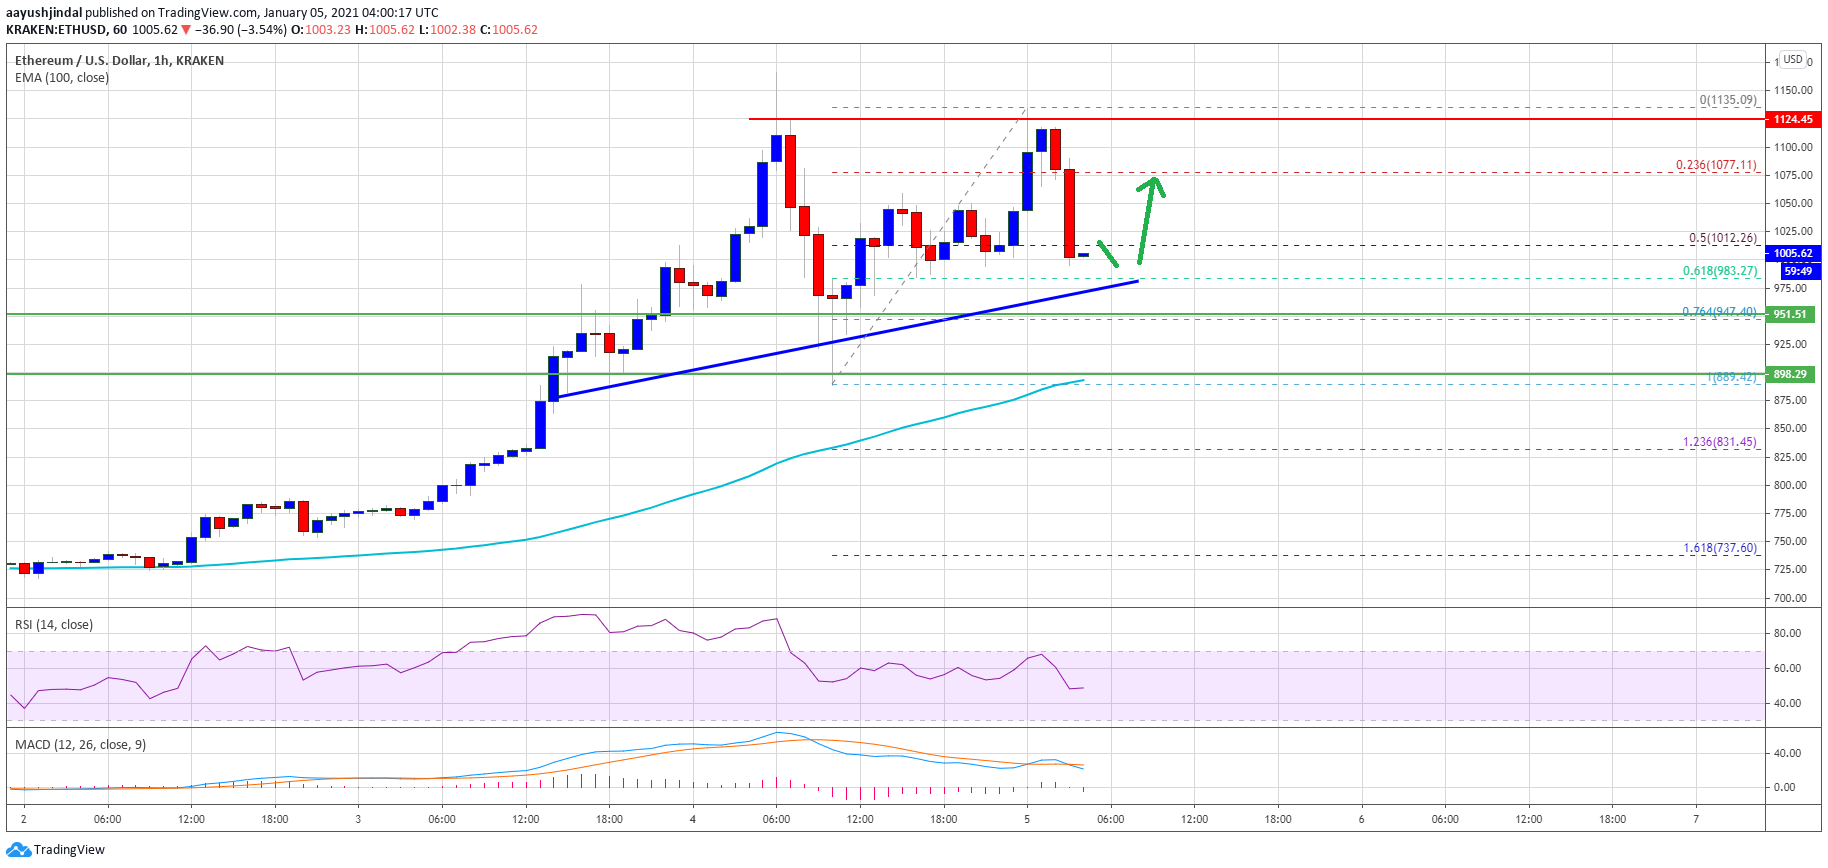
Source: ETHUSD on TradingView.com
There was a break below the 50% Fib retracement level of the recent wave from the $889 swing low to $1,135 high. On the downside, there is a strong support forming near the $980 and $950 levels. There is also a key bullish trend line forming with support near $980 on the hourly chart of ETH/USD.
The trend line is close to the 61.8% Fib retracement level of the recent wave from the $889 swing low to $1,135 high. On the upside, the price is facing hurdles near $1,050 and $1,080. The main resistance is now forming near $1,120, above which ether price might rally significantly.
More Downsides in ETH?
If ethereum fails to clear the $1,080 and $1,120 resistance levels, it could correct lower. An initial support on the downside is near the trend line at $980.
A downside break below the trend line support might lead ether price towards the $950 support zone. Any more losses may possibly call for a push towards the $900 level and the 100 hourly SMA in the near term.
Technical Indicators
Hourly MACD – The MACD for ETH/USD is showing a few bearish signs.
Hourly RSI – The RSI for ETH/USD is currently close to the 50 level.
Major Support Level – $980
Major Resistance Level – $1,120