
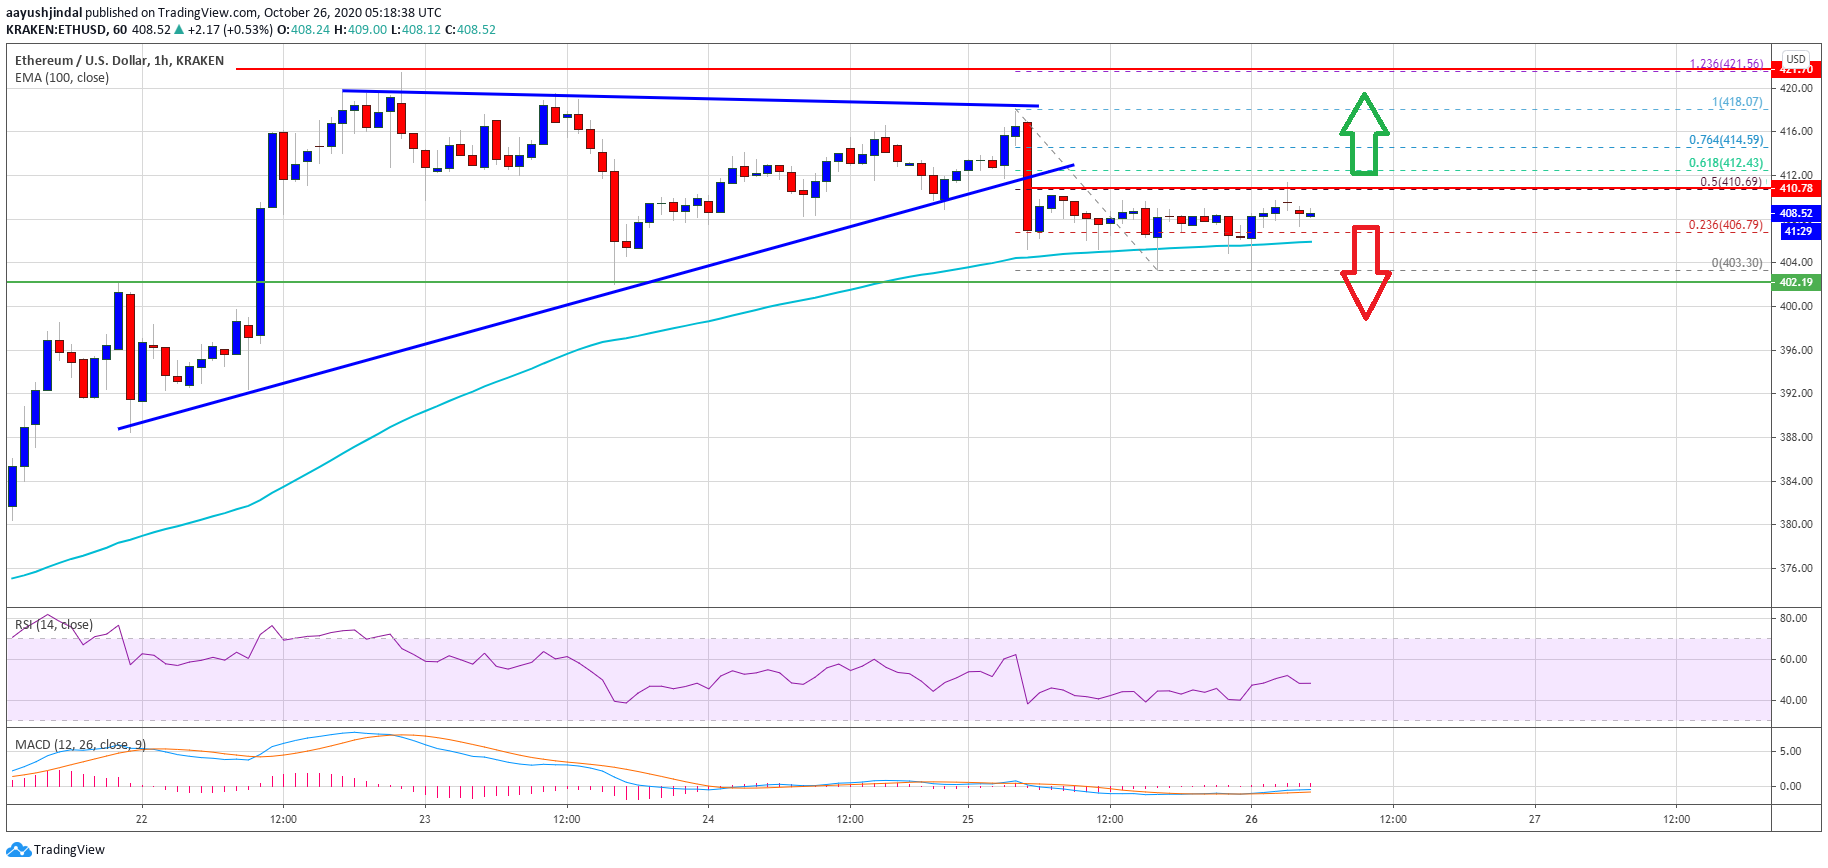
Ethereum is struggling to gain momentum above $410 and $420 against the US Dollar. ETH price might start a strong downside correction if it clears the $400 support.
- Ethereum is facing a couple of major hurdles near the $410 and $412 resistance levels.
- The price is currently holding the $400 support and the 100 hourly simple moving average.
- There was a break below a key contracting triangle with support near $412 on the hourly chart of ETH/USD (data feed via Kraken).
- The pair could start a sharp downside correction below $400 if it stays below $412 for too long.
Ethereum Price is Facing Hurdles
Ethereum failed to set a new monthly high above $420 unlike bitcoin against the US Dollar. ETH price seems to be facing a couple of major hurdles near the $410 and $412 resistance levels.
The last swing high was near $418 before the price declined below the $410 support. There was a break below a key contracting triangle with support near $412 on the hourly chart of ETH/USD. However, ether price remained well bid above the $400 support and the 100 hourly simple moving average.
A low is formed near $403 and the price is currently consolidating in a range. There was a break above the $405 level, but the price is facing a strong resistance near the $410 level. It is also close to the 50% Fib retracement level of the recent decline from the $418 high to $403 low.
Source: ETHUSD on TradingView.com
The next key resistance is near the $412 level or the 61.8% Fib retracement level of the recent decline from the $418 high to $403 low. If ether clears the $410 and $412 resistance levels, there are chances of a strong increase.
The next major resistance is near the $418 swing high and $420. A successful close above the $420 level might open the doors for a sharp increase in the coming sessions. The next stop on the upside could be near the $432 level, followed by $435.
Downside Break in ETH
If Ethereum fails to clear the $410 and $412 resistance levels, there is a risk of a fresh drop. The first major support is near the 100 hourly simple moving average and $405.
The main support seems to be forming near the $400 level. A continuous failure to gain traction above $410 might even result in a sharp decline below the $400 level (the last key breakout zone).
Technical Indicators
Hourly MACD – The MACD for ETH/USD is slowly moving in the bullish zone.
Hourly RSI – The RSI for ETH/USD is just below the 50 level.
Major Support Level – $400
Major Resistance Level – $412