
Ethereum started a steady increase and climbed above $580 against the US Dollar, similar to bitcoin. ETH price is consolidating gains and it could correct lower in the short-term.
- Ethereum gained bullish momentum above the $565 and $575 levels.
- The price is now trading above the $580 pivot zone and the 100 hourly simple moving average.
- There is a major bullish trend line forming with support near $579 on the hourly chart of ETH/USD (data feed via Kraken).
- The pair could correct lower, but the $580 and $575 levels are likely to provide support.
Ethereum Price Turns Green
After forming a support base near $535, Ethereum started a steady increase. ETH traded higher and broke a few important hurdles near the $550 level to move into a positive zone.
The price gained bullish momentum above the $565 and $575 levels. The upward move was such that ether price even surpassed the $580 resistance level and settled nicely above the 100 hourly simple moving average. It traded as high as $594 and it is currently consolidating gains.
There was a minor decline below the $585 level. The price even traded below the 23.6% Fib retracement level of the upward move from the $563 swing low to $594 high.
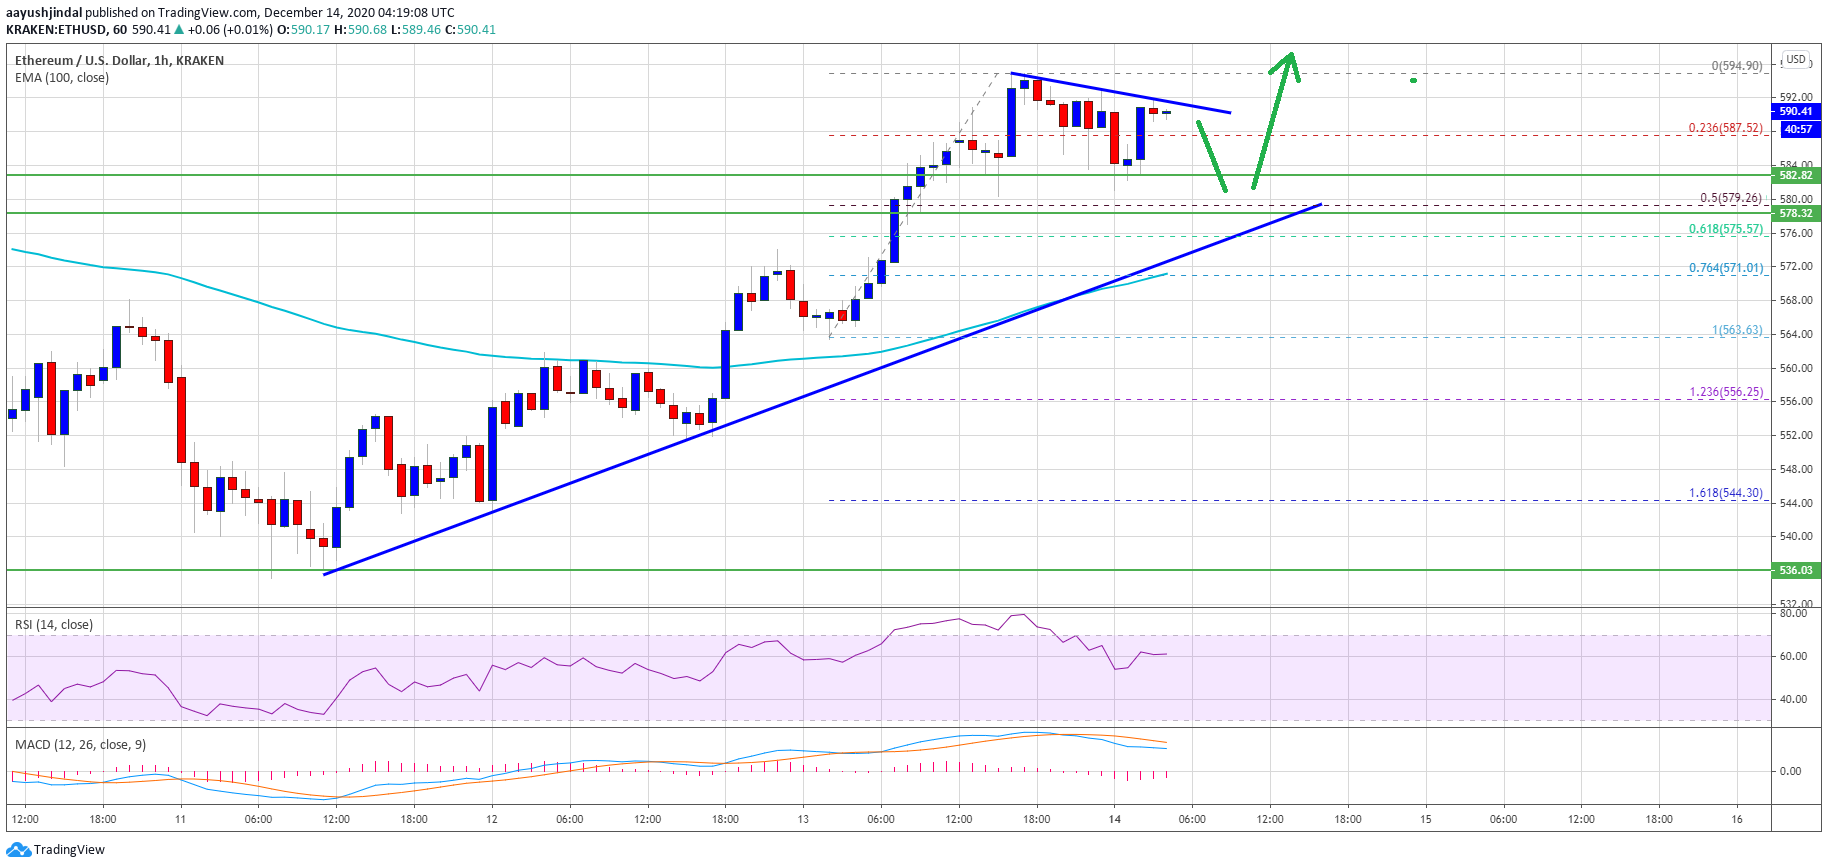
However, ether is finding a strong support near the $582 and $580 levels. There is also a major bullish trend line forming with support near $579 on the hourly chart of ETH/USD. The trend line coincides with the 50% Fib retracement level of the upward move from the $563 swing low to $594 high.
On the upside, the bulls are facing hurdles near the $592 and $594 levels. There is also a connecting bearish trend line with resistance at $592 on the same chart. The main resistance is still near the $600 level. A close above the $600 level is must for upside continuation.
Fresh Drop in ETH?
If ethereum fails to clear the $592 and $594 resistance levels, it could start a downside correction. An initial support zone is forming near the $580 level.
The next major support is near the $578 zone and the trend line. A close below the trend line could lead the price towards the $570 level and the 100 hourly simple moving average.
Technical Indicators
Hourly MACD – The MACD for ETH/USD is slowly losing momentum in the bullish zone.
Hourly RSI – The RSI for ETH/USD is currently correcting lower towards the 50 level.
Major Support Level – $580
Major Resistance Level – $594