- Bitcoin has recently undergone a strong retracement due to a confluence of factors.
- The cryptocurrency is around 20% below its year-to-date high at $12,500.
- Some fear that this retracement is the start of a return to a full-blow bear trend.
- Fortunately for bulls, there is evidence suggesting this is not the case.
- One crypto trader noted that Bitcoin’s three-week chart looks similar to how it did at the start of the previous macro bull run.
- This last bull run, which took place from 2015 to 2017, took BTC from the hundreds to $20,000.
- This positive sentiment is in line with prominent Wall Street investors who think Bitcoin is on the verge of parabolic growth.
Bitcoin’s Current Chart Looks Similar to Start of 2015-2017 Rally
One crypto trader recently noted that Bitcoin’s three-week RSI and 9 exponential moving average looks similar now to what it looked like at the start of the previous bull run.
Should Bitcoin follow the path it took last time the 9 exponential moving average and RSI looked as they did on the three-week chart, an exponential rally is in the works.
Then follow us on Google News!
Chart of BTC's price action over the past few years with analysis by crypto trader and chartist Polar Hunt (@Polar_Hunt).
Chart from TradingView.com
Wall Street Bulls Also Think BTC Will Go Exponential
Top Wall Street investors think an exponential rally is poised to begin, corroborating the aforementioned analysis.
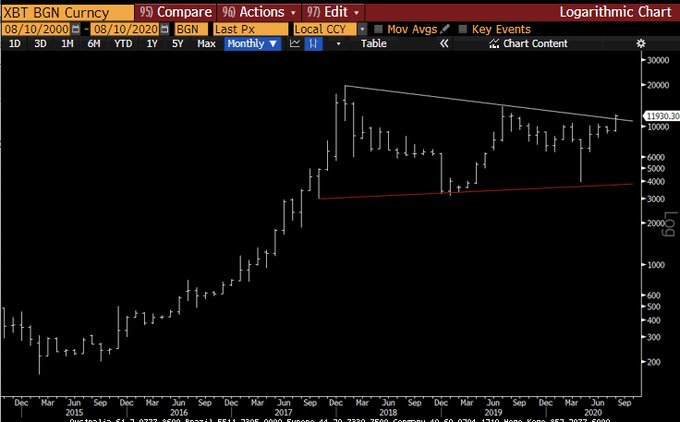
Dan Tapiero, co-founder of DTAP Capital and Gold Bullion, recently stated that the cryptocurrency is poised to go exponential:
“Tremendous long term Log Chart of #Bitcoin projects up 5-10x on this run. Just breaking up NOW. Should last a few years as 2.5yr consolidation is fantastic base for catapult up. Break of old highs will have explosive follow through. Time to sit and be patient.”
Chart of BTC's macro price action (Logarithimic chart) by Bitcoin bull and gold investor Dan Tapiero. Chart from Bloomberg
His contemporary, Raoul Pal, formerly of Goldman Sachs, wrote in his own analyses that the cryptocurrency could reach over $100,000 this bull cycle.
Featured Image from Shutterstock
Price tags: xbtusd, btcusd, btcusdt
Charts from TradingView.com
Historical Analysis: Bitcoin Looks Extremely Similar to the Start of the $20k Rally

Bitcoinist.com is author of this content, TheBitcoinNews.com is is not responsible for the content of external sites.
source: https://bitcoinist.com/historical-analysis-bitcoin-looks-extremely-similar-to-the-start-of-the-20k-rally/?utm_source=rss&utm_medium=rss&utm_campaign=historical-analysis-bitcoin-looks-extremely-similar-to-the-start-of-the-20k-rally
TheBitcoinNews.com is here for you 24/7 to keep you informed on everything crypto. Like what we do? Tip us some BAT
Send Tip now!

