
Ripple started a strong decline after it failed near $0.3700 against the US Dollar. XRP price is currently testing a major support near $0.2600 and the 100 SMA (H4).
- Ripple is down over 20% and it broke a couple of major supports at $0.3000 against the US dollar.
- The price tested the $0.2600 support zone and the 100 simple moving average (4-hours).
- There is a key bearish trend line forming with resistance near $0.3320 on the 4-hours chart of the XRP/USD pair (data source from Kraken).
- The pair must stay above $0.2600 and $0.2500 to start a fresh increase in the near term.
Ripple’s XRP Price is Down 20%
In the past few days, ripple’s XRP price made two attempts to gain strength above $0.3650 and $0.3700. The bulls failed to remain in control, resulting in a sharp decline below the $0.3200 support.
Today, bitcoin and ethereum saw a sharp decline as well, accelerating decline in XRP below the $0.3000 support level. The price declined over 20% and it broke the 23.6% Fib retracement level of the upward wave from the $0.1759 swing low to $0.3700 swing high.
There is also a key bearish trend line forming with resistance near $0.3320 on the 4-hours chart of the XRP/USD pair. The price is now testing the $0.2600 support zone and the 100 simple moving average (4-hours).
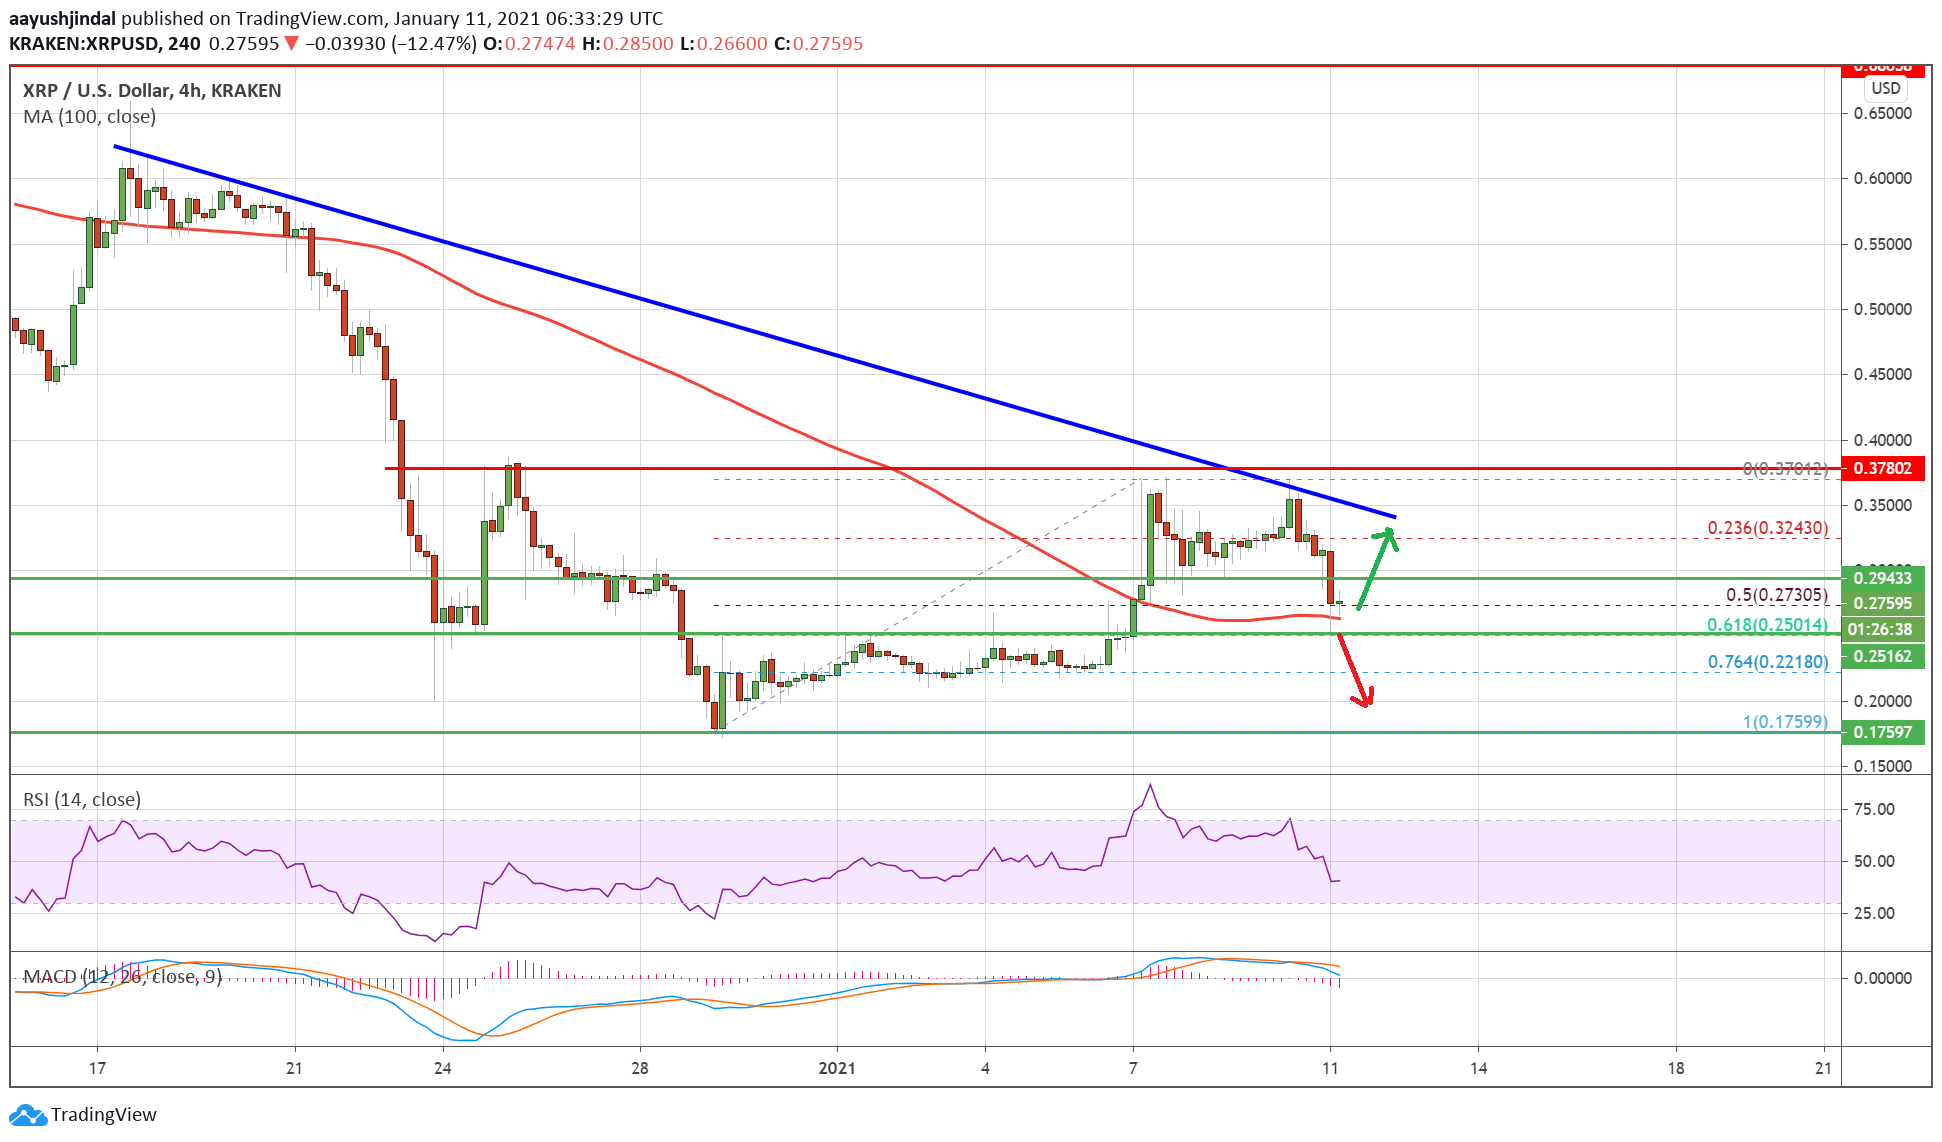
The 50% Fib retracement level of the upward wave from the $0.1759 swing low to $0.3700 swing high is also acting as a strong support.
If the price fails to stay above the $0.2600 and $0.2500 support levels, there is a risk of a sharp decline. In the stated case, the price could continue to move down towards the $0.2200 and $0.2120 support levels.
Fresh Recovery in XRP?
If ripple remains stable above the $0.2500 level, there are chances of a fresh increase. An initial resistance on the upside is near the $0.2920 level.
The first key resistance for the bulls is near the $0.3000 level. The main resistance is now near $0.3300 and the bearish trend line. A close above the $0.3300 resistance zone could push the price towards the $0.3700 and $0.3800 levels in the near term.
Technical Indicators
4-Hours MACD – The MACD for XRP/USD is gaining momentum in the bearish zone.
4-Hours RSI (Relative Strength Index) – The RSI for XRP/USD is now well below the 50 level.
Major Support Levels – $0.2600, $0.2500 and $0.2220.
Major Resistance Levels – $0.2920, $0.3120 and $0.3300.