
Ripple is showing positive signs above the $0.2500 support against the US Dollar. XRP price could start a strong rally if it clears the $0.2550 resistance zone.
- Ripple recovered nicely and climbed above the $0.2505 pivot level against the US dollar.
- The price is now trading well above $0.2500 and the 100 simple moving average (4-hours).
- There is a crucial declining channel forming with resistance near $0.2540 on the 4-hours chart of the XRP/USD pair (data source from Kraken).
- The pair could rally 8%-10% if it clears the key $0.2550 resistance in the near term.
Ripple Price Approaching Next Key Breakout
After a strong upward move in bitcoin, there was a fresh increase ripple from the $0.2440 support. XRP broke the $0.2480 and $0.2500 resistance levels to move into a positive zone.
The price even broke the 23.6% Fib retracement level of the recent decline from the $0.2639 high to $0.2439 low. XRP is now trading well above $0.2500 and the 100 simple moving average (4-hours). On the upside, it is facing a major hurdle near the $0.2540 and $0.2550 levels.
There is also a crucial declining channel forming with resistance near $0.2540 on the 4-hours chart of the XRP/USD pair. The channel resistance is close to the 50% Fib retracement level of the recent decline from the $0.2639 high to $0.2439 low.
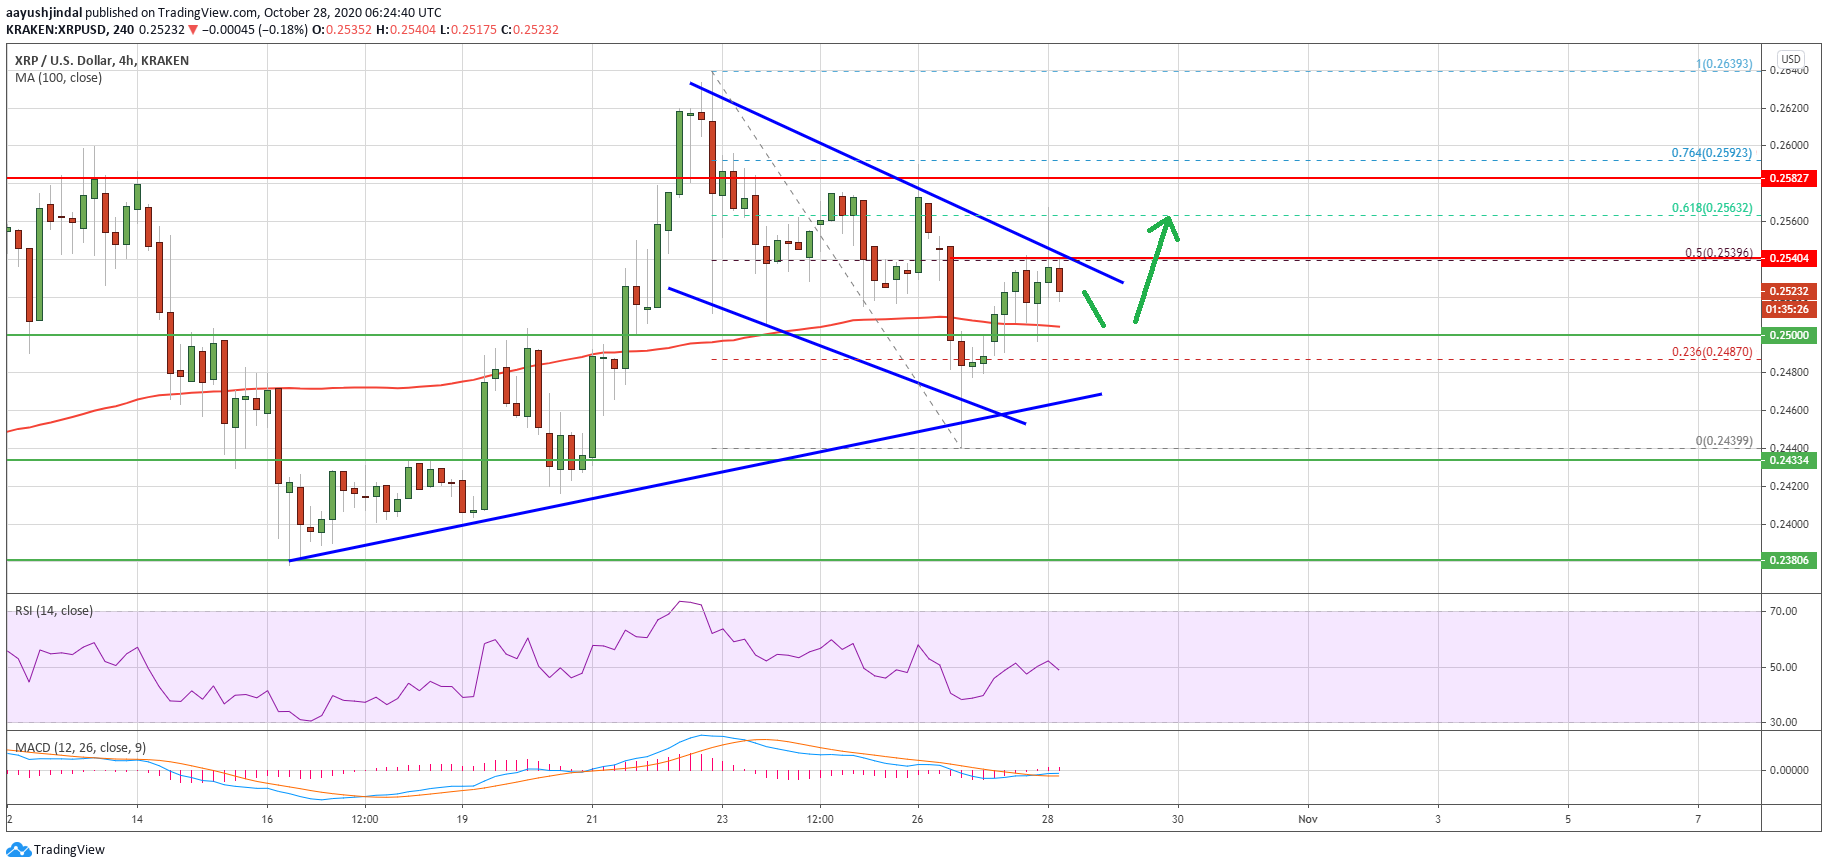
Source: XRPUSD on TradingView.com
The pair could start if it clears the $0.2540 and $0.2550 resistance levels. The next major resistance is near the $0.2580 level. A clear break above $0.2580 could open the doors for a sharp increase above $0.2600.
The next major resistance for the bulls might be near the $0.2620, above which ripple could accelerate higher towards the $0.2700 level in the near term.
Key Breakdown Support for XRP
If ripple fails to clear the $0.2540 and $0.2550 resistance levels, there is a risk of a bearish breakdown. The first key support is near the $0.2500 level and the 100 simple moving average (4-hours).
The next major support is near a connecting bullish trend line on the same chart at $0.2460. A successful break below the trend line support could lead the price towards the $0.2400 level.
Technical Indicators
4-Hours MACD – The MACD for XRP/USD is likely to move into the bullish zone.
4-Hours RSI (Relative Strength Index) – The RSI for XRP/USD is now struggling to settle above the 50 level.
Major Support Levels – $0.2500, $0.2460 and $0.2440.
Major Resistance Levels – $0.2540, $0.2550 and $0.2600.