
Ripple is trading in a positive zone above the $0.2920 support zone against the US Dollar. XRP price is likely to continue higher if it clears the $0.3055 resistance zone.
- Ripple gained bullish momentum and settled above the $0.2920 pivot against the US dollar.
- The price is currently struggling to clear $0.3055, but it is well above the 100 hourly SMA.
- There is a key bullish trend line forming with support near $0.2960 on the hourly chart of the XRP/USD pair (data source from Kraken).
- The pair could start a strong increase once it clears the main $0.3055 resistance zone.
Ripple Price Holding Key Support
After forming a support base near the $0.2750 level, ripple started a fresh upward move. XRP price broke the $0.2850 and $0.2920 resistance levels to move into a positive zone.
The price even climbed above the $0.3000 level and settled well above the 100 hourly simple moving average. However, the bulls seem to be facing an uphill task near the $0.3055 and $0.3060 level.
The recent high was formed near $0.3074 and the price is currently consolidating gains. It declined below the 23.6% Fib retracement level of the upward move from the $0.2299 low to $0.3074 swing high. It seems like the price is holding a couple of important supports near $0.2950 and $0.2920.
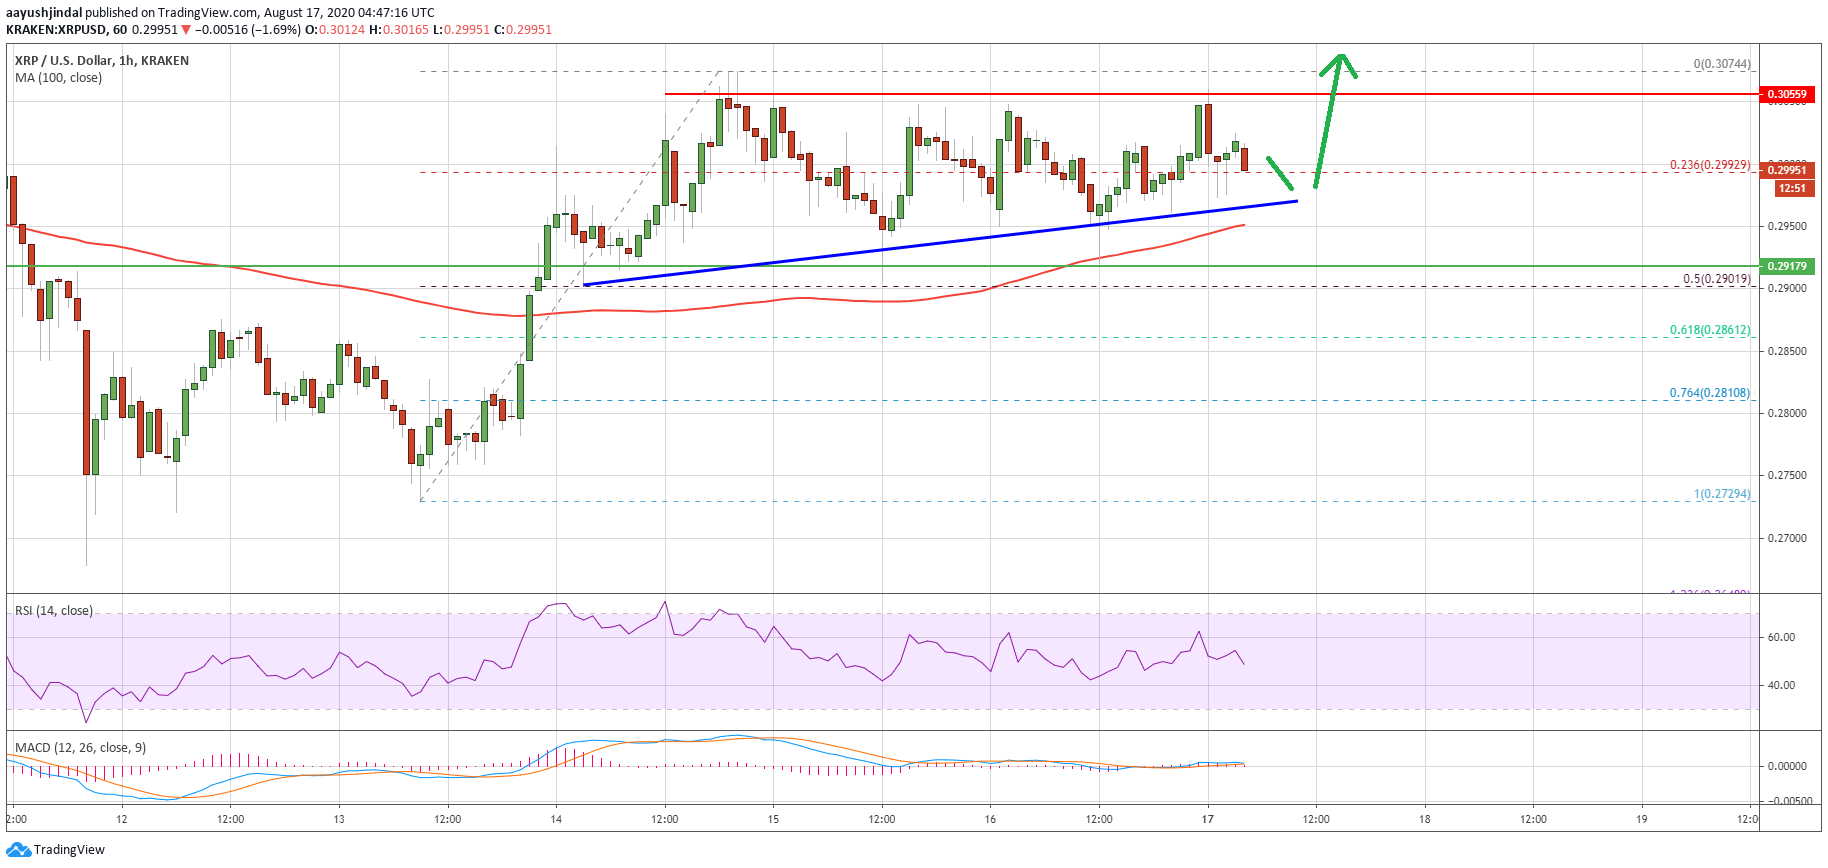
Ripple price above $0.2950. Source: TradingView.com
There is also a key bullish trend line forming with support near $0.2960 on the hourly chart of the XRP/USD pair. Below the trend line, the 100 hourly SMA is near the $0.2950. The main support is now forming near the $0.2920 level.
On the upside, ripple supporters are facing a major resistance near $0.3055. A successful close above $0.3055 and $0.3060 could open the doors for a strong rise in the coming sessions.
Downside Break in XRP?
There is a crucial support base forming near the $0.2920 level. If ripple fails to stay above $0.2920, it could test the 50% Fib retracement level of the upward move from the $0.2299 low to $0.3074 swing high.
Any further losses may perhaps spark a downside break and the price might decline towards the $0.2850 and $0.2810 support levels.
Technical Indicators
Hourly MACD – The MACD for XRP/USD is slowly moving in the bullish zone.
Hourly RSI (Relative Strength Index) – The RSI for XRP/USD is currently just above the 50 level.
Major Support Levels – $0.2960, $0.2950 and $0.2920.
Major Resistance Levels – $0.3020, $0.3055 and $0.3120.