
Ripple is trading with a minor bearish angle below $0.3020 against the US Dollar. XRP price must stay above $0.2850 to start a fresh increase in the near term.
- Ripple is declining steadily and it even broke the $0.3000 support zone against the US dollar.
- The price is currently testing the $0.2980 support zone and the 100 hourly SMA.
- There is a major bullish trend line forming with support near $0.2840 on the hourly chart of the XRP/USD pair (data source from Kraken).
- The pair could struggle to bounce back in the near term if there is a break below the $0.2850 zone.
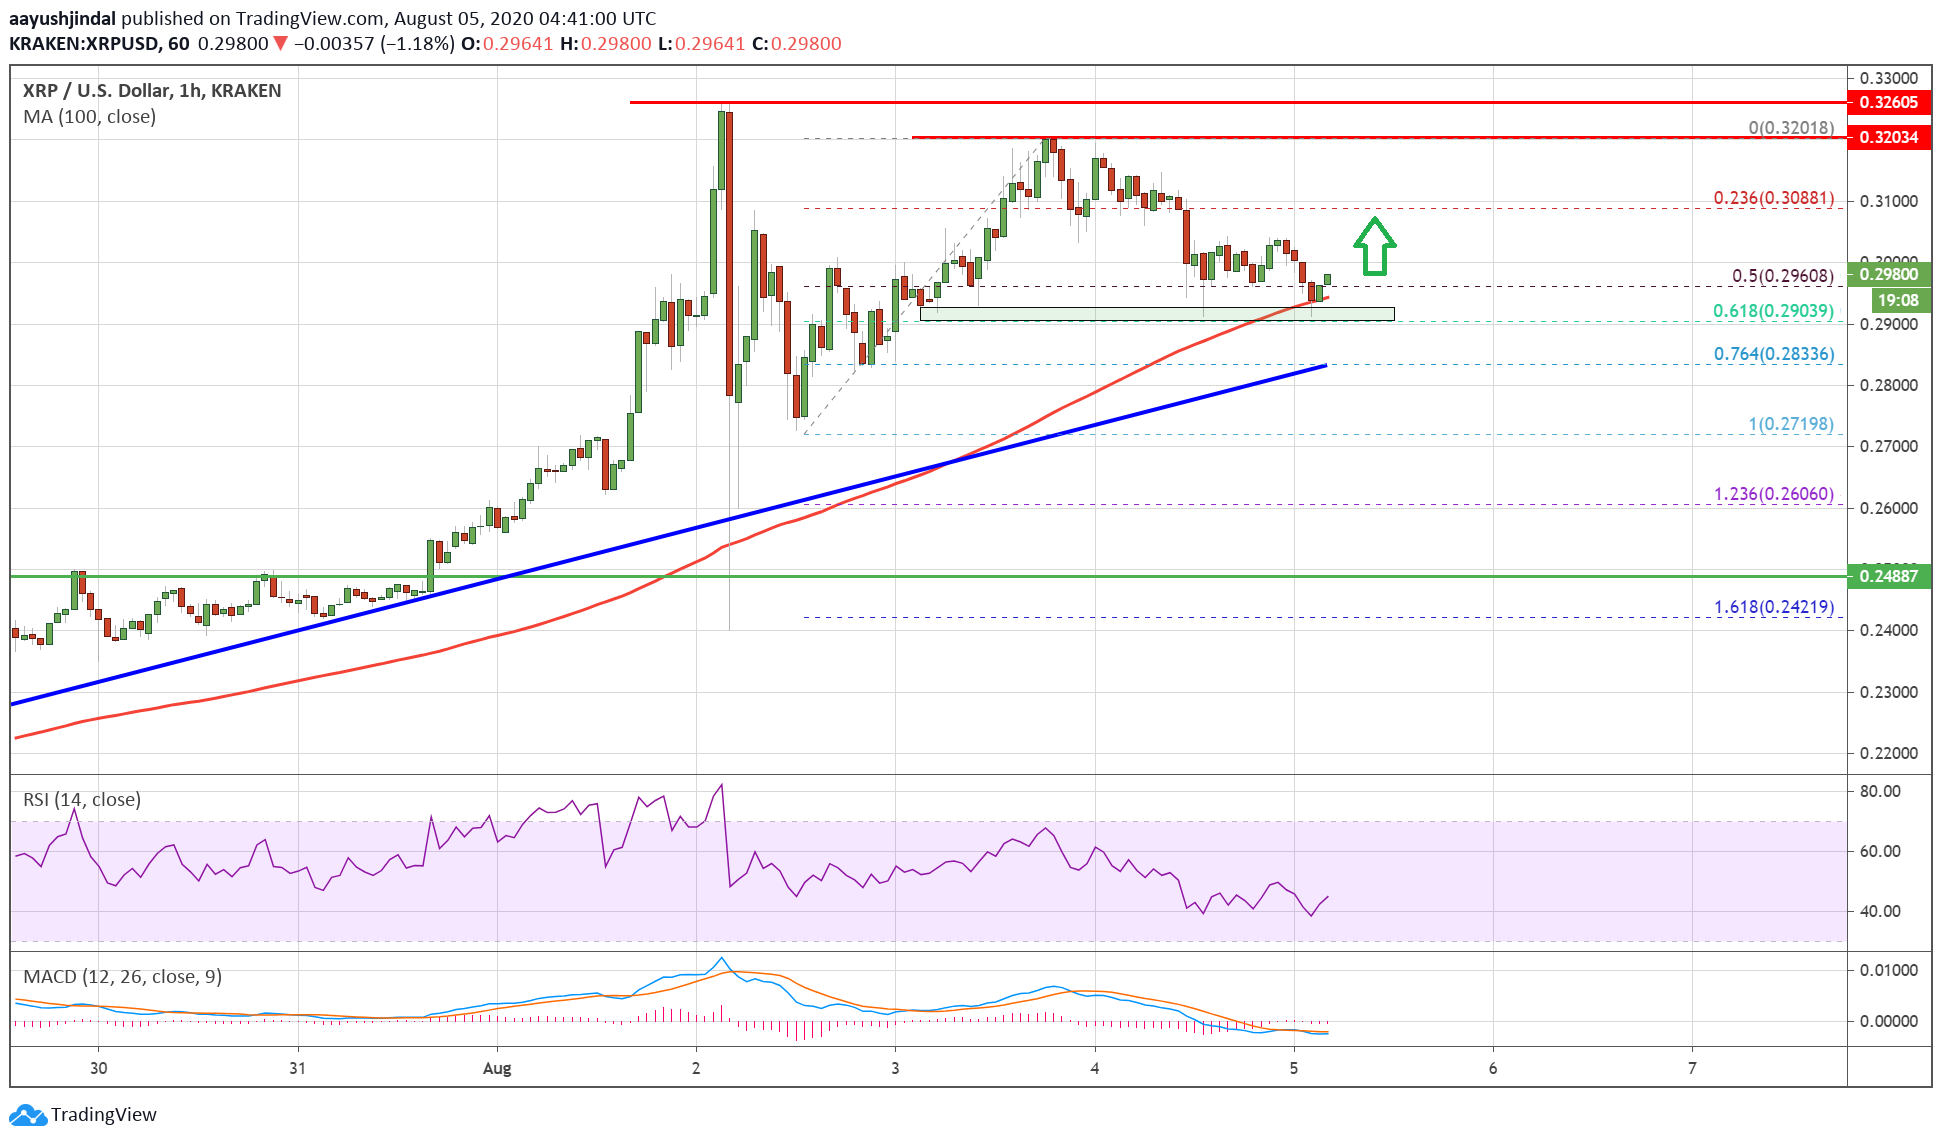
Ripple Price Testing Key Support
After another rejection above $0.3120, ripple started a steady decline. XRP price broke the $0.3050 and $0.3020 support levels to move into a short-term bearish zone.
The decline was such that the price broke the 50% Fib retracement level of the upward move from the $0.2719 low to $0.3200 swing high. It even traded below the $0.3000 support level and tested the 100 hourly simple moving average.
The 61.8% Fib retracement level of the upward move from the $0.2719 low to $0.3200 swing high is also acting as a decent support. There is also a major bullish trend line forming with support near $0.2840 on the hourly chart of the XRP/USD pair.
Ripple price below $0.1900. Source: TradingView.com
On the upside, the pair is facing hurdles near the $0.3020 level. The first major resistance is near the $0.3050 level, above which the price might attempt to clear the $0.3120 level. If the bulls succeed, the price could rise towards the main $0.3200 resistance zone.
Downside Break in XRP
The 100 hourly SMA and the $0.2900 zone are major supports for ripple. If the bulls fail to protect the $0.2900 support, the price could continue to move down towards the trend line support.
The $0.2850 zone and the trend line hold the key. If there is a clear break below the trend line support, the bears are likely to take control and the price might decline below the $0.2800 level. The next major support is seen near the $0.2650 level.
Technical Indicators
Hourly MACD – The MACD for XRP/USD is about to move back into the bullish zone.
Hourly RSI (Relative Strength Index) – The RSI for XRP/USD is still well below the 50 level.
Major Support Levels – $0.2900, $0.2850 and $0.2840.
Major Resistance Levels – $0.3020, $0.3050 and $0.3120.