
Ripple surged over 40% and it even broke the $0.4500 resistance against the US Dollar. XRP price weekly chart suggests high chances of more upsides towards $0.6000 and $0.7500.
- Ripple started a strong surge after it broke the $0.3000 resistance zone against the US dollar.
- The price even cleared the $0.4000 resistance and settled well above the 100-week simple moving average.
- There was a break above a crucial bearish trend line with resistance near $0.2950 on the weekly chart of the XRP/USD pair (data source from Kraken).
- The pair remains elevated and the bulls could aim a test of $0.6000 or even $0.7500.
Ripple’s XRP Price Rallies 40%
In the past few days, there was a sharp increase in ripple’s XRP price above the $0.3000 resistance zone. The price gained pace after there was a proper close above $0.3000 and the 100-week simple moving average.
More importantly, there was a break above a crucial bearish trend line with resistance near $0.2950 on the weekly chart of the XRP/USD pair. It opened the doors for a sharp increase above $0.3200 and $0.3500. The price even surged above the 61.8% Fib retracement level of the main decline from the $0.5081 swing high to $0.1131 swing low.
Ripple price settled above the $0.4000 resistance and spiked towards $0.5000. The price is now trading above the 76.4% Fib retracement level of the main decline from the $0.5081 swing high to $0.1131 swing low.
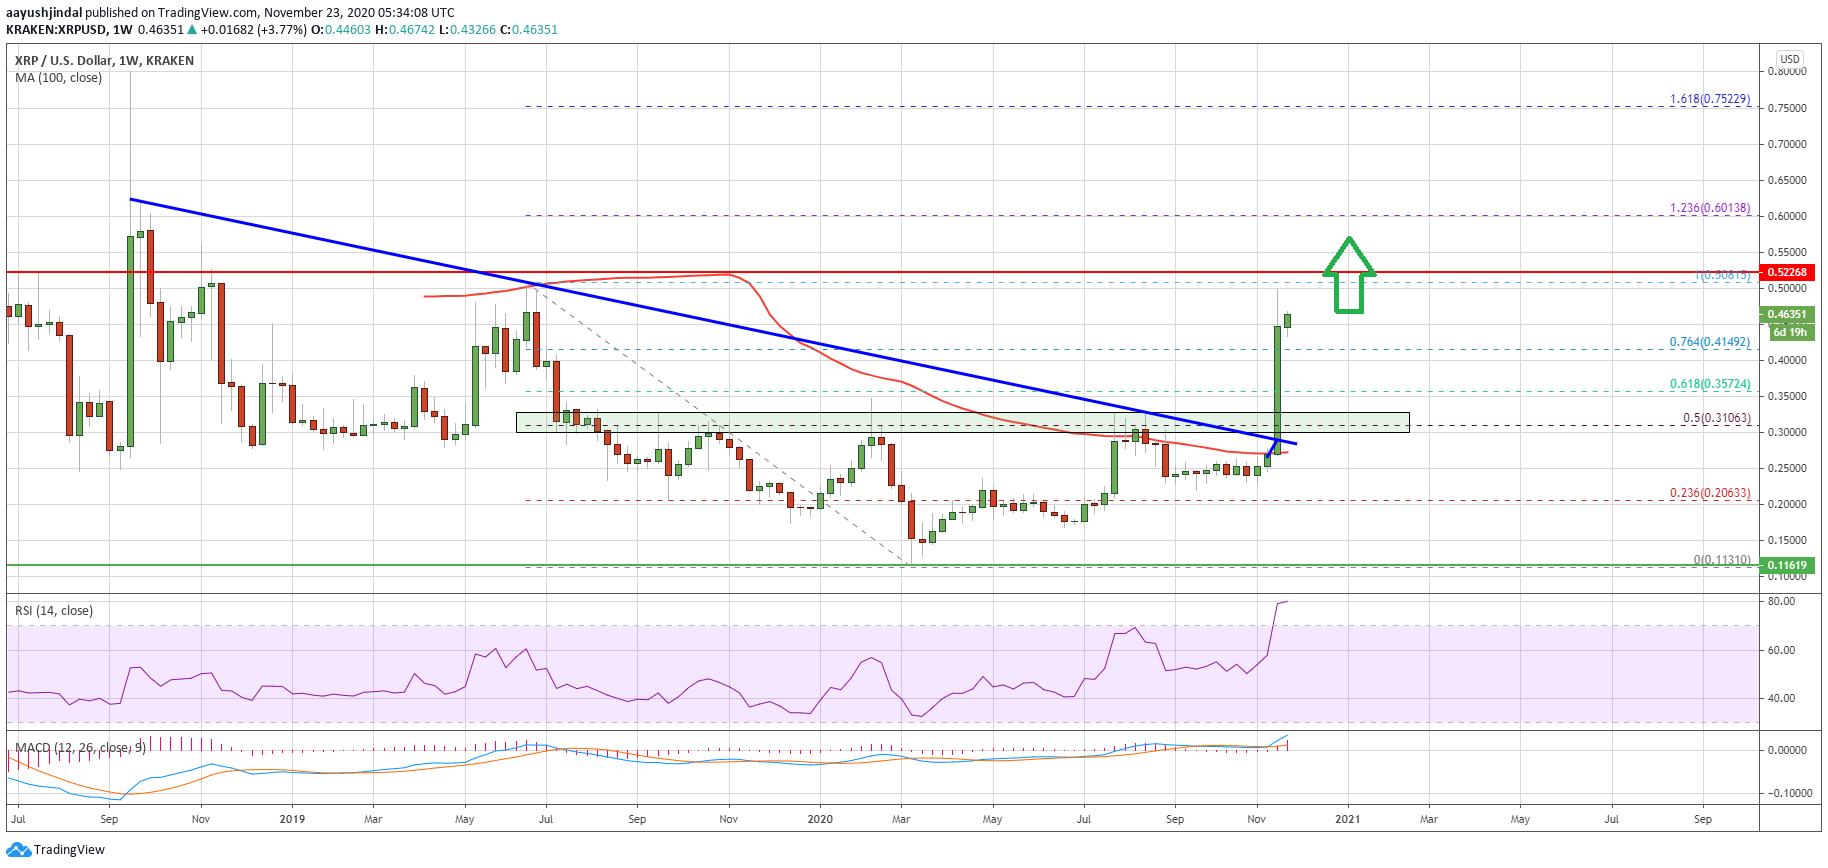
Source: XRPUSD on TradingView.com
The current weekly candle seems positive and it seems like there are chances of more upsides above $0.5000 and the $0.5080 swing high. The next target for the bulls could be $0.6000 level. Any further gains could open the doors for a rally towards the $0.7500 level.
The 1.618 Fib extension level of the main decline from the $0.5081 swing high to $0.1131 swing low at $0.7522 could be the target of the bulls in the coming weeks.
Dips Limited in XRP?
If ripple fails to clear the $0.5000 and $0.5080 resistance levels, there could be a downside correction. The first key support is near the $0.4150 level.
The next major support is near the $0.3550 level (a multi-touch zone), below which the price could drop towards the $0.3000 breakout zone and the 100-week simple moving average.
Technical Indicators
4-Hours MACD – The MACD for XRP/USD is now gaining pace in the bullish zone.
4-Hours RSI (Relative Strength Index) – The RSI for XRP/USD is currently well above the 70 level.
Major Support Levels – $0.4150, $0.3850 and $0.3550.
Major Resistance Levels – $0.5000, $0.5080 and $0.6000.