
Bitcoin price managed to stay above the $10,550 support and climbed above $10,800 against the US Dollar. BTC is now facing the main hurdle near the $10,950 and $11,000 levels.
- Bitcoin is up over 2% and it found a strong buying interest near the $10,550 support level.
- The price is trading above the 100 hourly simple moving average, but facing hurdles near $10,950.
- There was a break above a major bearish trend line with resistance near $10,635 on the hourly chart of the BTC/USD pair (data feed from Kraken).
- The pair could rally if it clear the $10,950 and $11,000 resistance levels.
Bitcoin Price is Attempting Bullish Breakout
Bitcoin price made another attempt to clear the $10,550 support against the US Dollar. However, BTC remained well bid above the $10,550 support level, resulting in a fresh bullish reaction.
There was a break above the $10,650 and $10,700 resistance levels to start a decent upward move. More importantly, there was a break above a major bearish trend line with resistance near $10,635 on the hourly chart of the BTC/USD pair.
Bitcoin is up over 2% and it cleared the $10,800 resistance level. The upward move was such that the price even spiked above the $10,950 resistance. A new intraday high is formed near $10,971 and the price is currently consolidating gains.
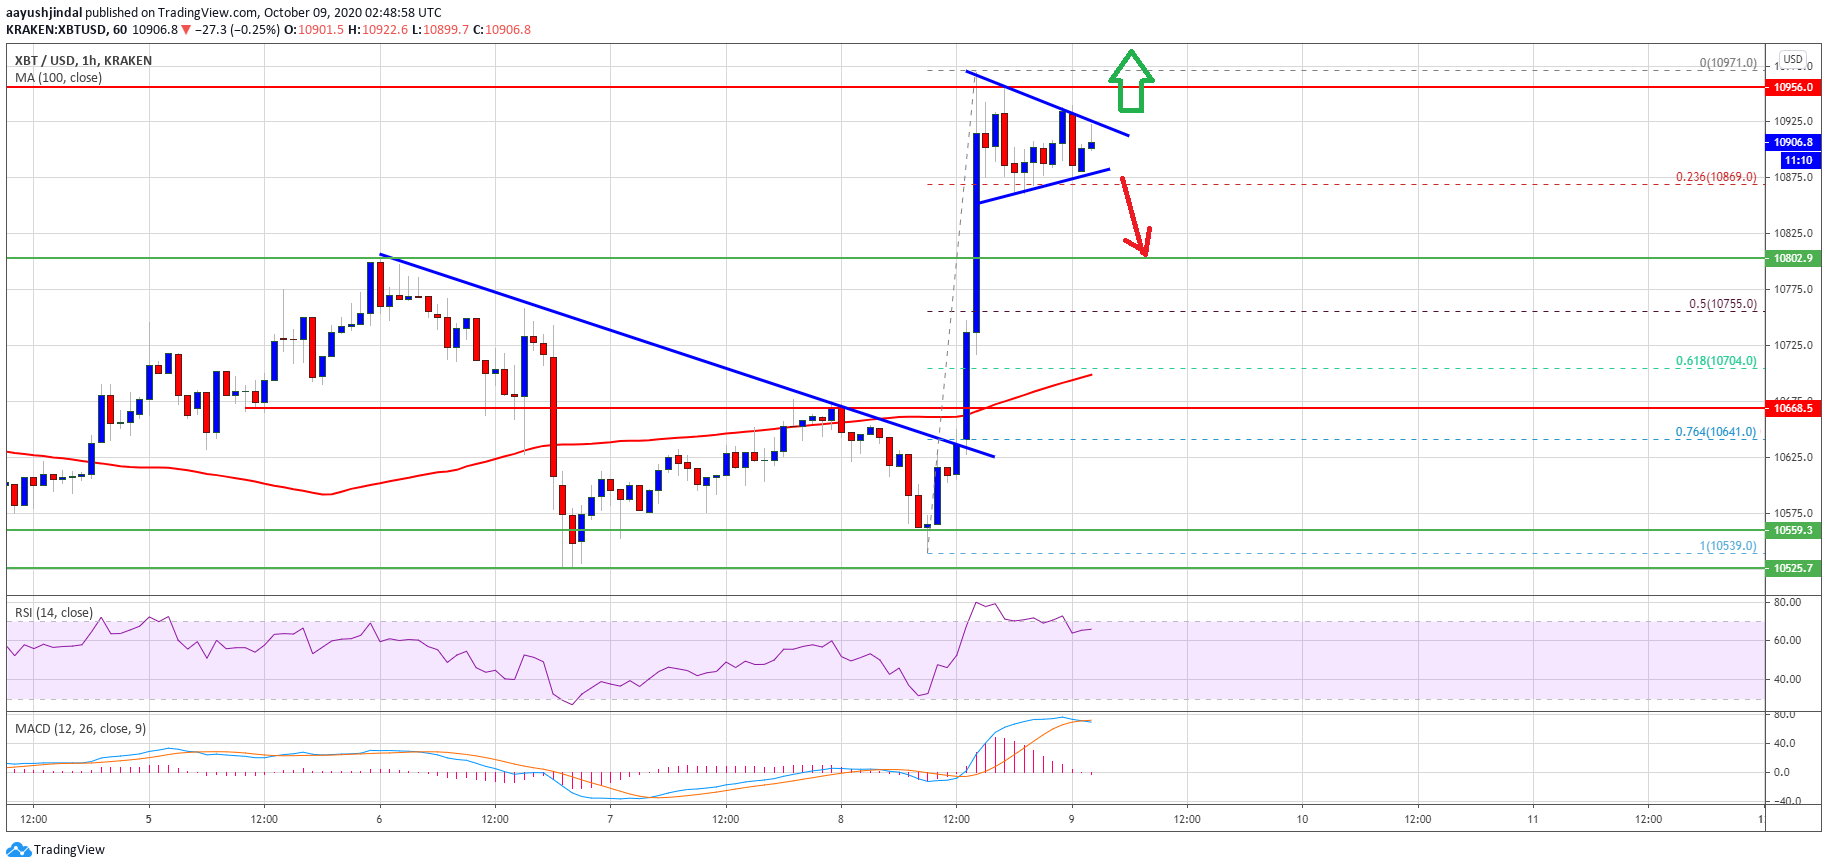
Bitcoin price recovers above $10,800. Source: TradingView.com
It seems like there is a contracting triangle forming with support near $10,880 on the same chart. The triangle support is close to the 23.6% Fib retracement level of the recent increase from the $10,539 low to $10,971 high.
On the upside, the first major resistance is near the $10,950 level. The main hurdle is still near the $11,000 level. A successful close above the $11,000 resistance could open the doors for a sustained upward move towards $11,500 in the near term.
Dips Now Supported in BTC?
The first key support for bitcoin is near the triangle trend line at $10,880. The next major support is near the $10,800 level or the 50% Fib retracement level of the recent increase from the $10,539 low to $10,971 high.
Any further losses could lead the price towards the $10,700 support level since it is close to the 100 hourly simple moving average.
Technical indicators:
Hourly MACD – The MACD is showing positive signs in the bullish zone.
Hourly RSI (Relative Strength Index) – The RSI for BTC/USD is currently well above the 60 level.
Major Support Levels – $10,880, followed by $10,800.
Major Resistance Levels – $10,950, $11,000 and $11,200.