
Bitcoin price started consolidating losses after a sharp decline to $10,300 against the US Dollar. BTC is likely to face a lot of hurdles near $10,550, $10,600 and $10,650.
- Bitcoin is slowly recovering higher from the new weekly low at $10,302.
- The price is still below the $10,550 resistance and the 100 hourly simple moving average.
- There is a connecting bearish trend line forming with resistance near $10,680 on the hourly chart of the BTC/USD pair (data feed from Kraken).
- The pair could correct higher, but the bears are likely to protect gains above $10,600 in the short-term.
Bitcoin Price is Facing Hurdles
Yesterday, we saw a sharp decline in bitcoin price below the $10,650 and $10,550 support levels against the US Dollar. BTC even settled well below the 100 hourly simple moving average, and traded to a new weekly low near $10,300.
It is currently recovering above the $10,400 level. There was a break above the 23.6% Fib retracement level of the downward move from the $10,990 swing high to $10,300 swing low. However, the previous key support near the $10,550 level is currently acting as a resistance.
It seems like bitcoin bears are likely to remain active if the price climbs above $10,550. The first major resistance is near the $10,650 level. It is close to the 50% Fib retracement level of the downward move from the $10,990 swing high to $10,300 swing low.
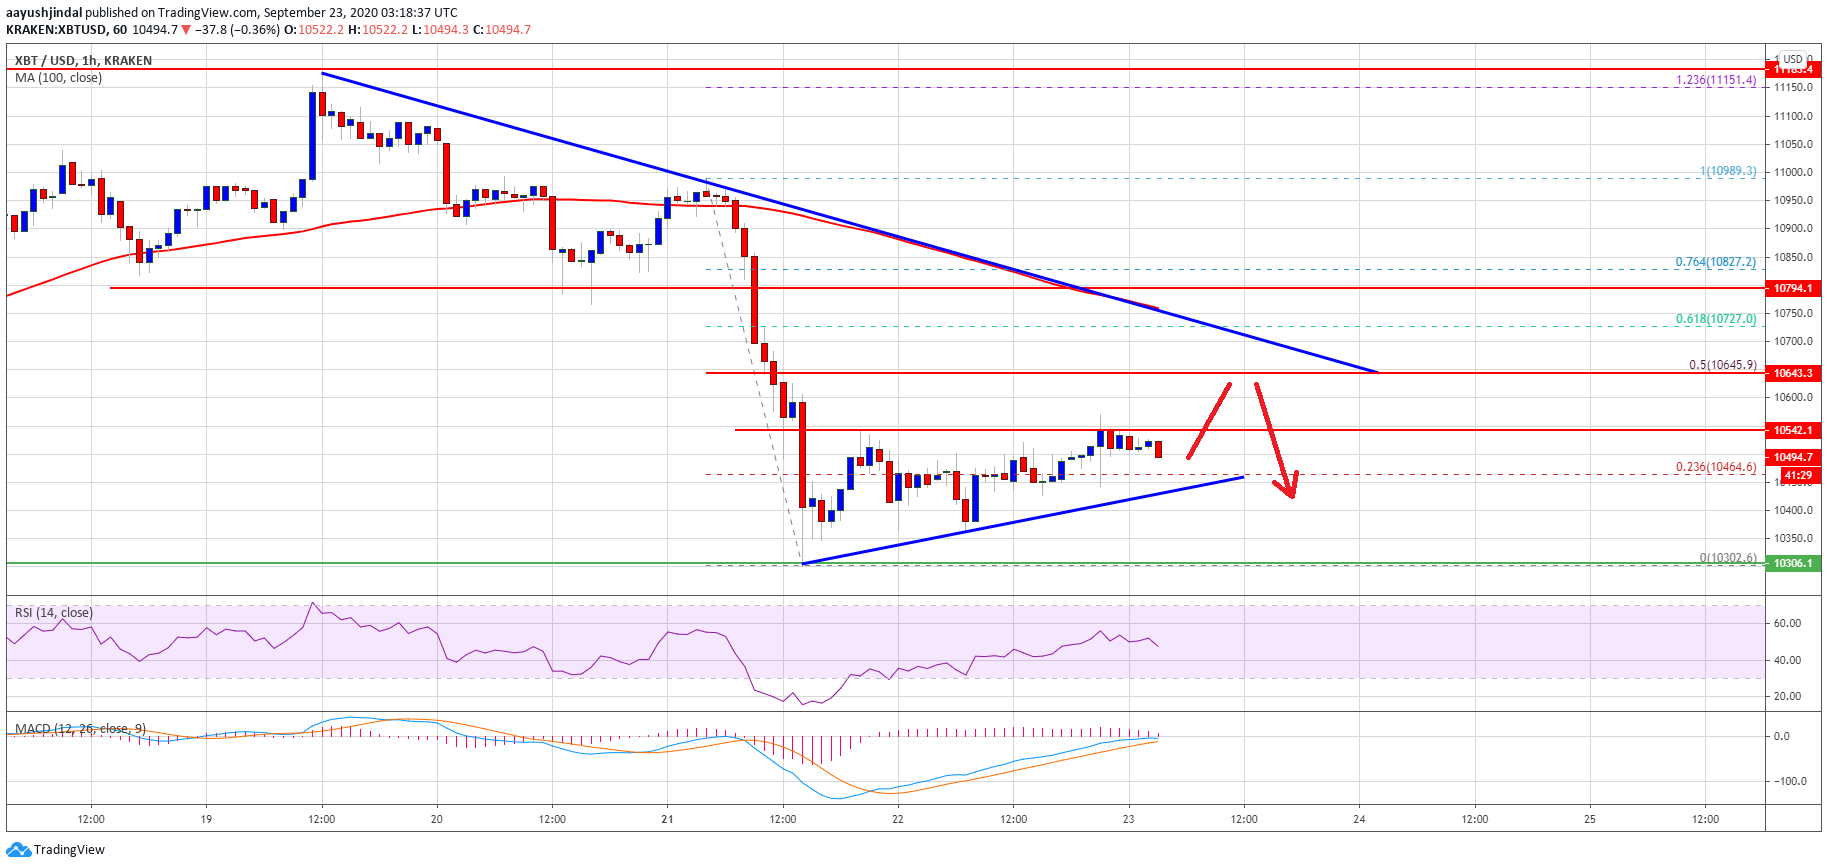
Bitcoin price struggling near $10,550. Source: TradingView.com
There is also a connecting bearish trend line forming with resistance near $10,680 on the hourly chart of the BTC/USD pair. To move into a positive zone, the bulls need to overcome selling pressure and push the price above $10,650 and the trend line. The next major resistance above the trend line could be near $11,000.
Fresh Decline in BTC?
If bitcoin fails to recover above the $10,600 and $10,650 levels, it could start a fresh decline. An initial support is near a short-term bullish trend line with support at $10,450 on the same chart.
A downside break below the trend line could open the doors for more losses below $10,400. The next support is near the $10,300 level, below which the bulls might struggle to protect the $10,200 support zone.
Technical indicators:
Hourly MACD – The MACD is likely to move back into the bearish zone.
Hourly RSI (Relative Strength Index) – The RSI for BTC/USD is struggling to stay above the 50 level.
Major Support Levels – $10,450, followed by $10,300.
Major Resistance Levels – $10,550, $10,650 and $10,680.