
- On a macro scale, Bitcoin has yet to break out.
- Despite surging around 20% in the past 1.5 months, the coin remains under crucial long-term resistances.
- One pivotal level analysts are looking towards is $14,000, as that’s where the 2019 rally topped and highs of December 2017 ended up at (monthly candle).
- Analysts remain long-term bullish on Bitcoin despite the barriers to overcome.
- One on-chain and quantitative analyst noted that a key on-chain indicator for BTC looks similar to how it did prior to 2017’s rally.
- Should history repeat itself, BTC is on the verge of parabolic growth.
Bitcoin Looks As It Did Prior to 2017’s Rally, Crucial On-Chain Indicator Shows
Hans Hauge of Ikigai, a cryptocurrency fund, recently noted that Bitcoin’s long-term trend is still one of growth.
He posted the chart below on September 16th, which shows that BTC’s Reserve Risk is currently in a consolidation formation similar to the one that preceded the 2017 rally from under $1,000 to $20,000:
Then follow us on Google News!
Chart of BTC's macro price action with an on-chain analysis from Hans HODL.
Other on-chain trends also suggest that Bitcoin is on the verge of a longer-term growth trend.
Willy Woo, a noted on-chain and technical analyst, shared the chart below on September 14th. It shows that BTC has a “lot of room for growth in this cycle.”
“Another impulse of coins changing hands has completed, the next directional move over the coming weeks is likely upwards. It’s very unlikely we’ll see any kind of a catastrophic dump in price from here. […] Overall, I’m not expecting any mega dump, some chance of smaller whipsaws in the short timeframes, resistance is teetering. Not a bad time to get in if you’re a spot investor, given the longer range macro. There’s plenty of buy support below 10k, this is a buy the dip scenario.”
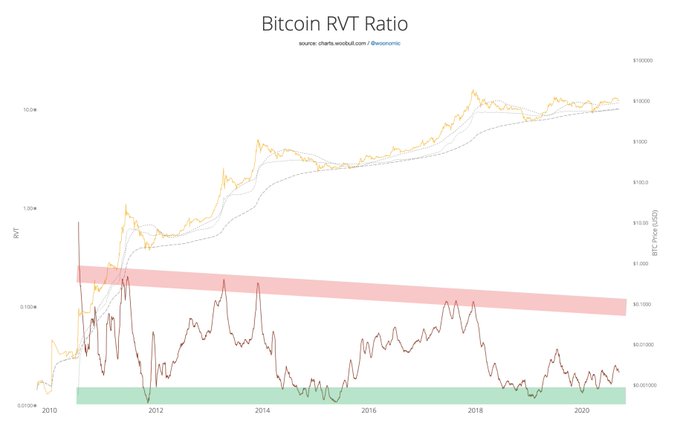
Chart of BTC's macro price action with an RVT Ratio analysis from Willy Woo (@Woonomic on Twitter)
Don’t Count Out One Final Drop
Analysts aren’t counting out a situation where Bitcoin undergoes one final correction, though.
Willy Woo stated on BTC’s potential to fill the CME futures gap in the high-$9,000s:
“I’m still cautious of another short term dump to fill the gap but so far it’s looking like it’s been front run for liquidity which is strongly bullish if we break resistance here. There’s a lot of bids in the spot orderbooks wanting to snap up the gap in the mid-high 9000s.”
Others have shared a similar sentiment, noting how Bitcoin falling and bouncing off the low-$9,000s would actually mark a bullish retest as opposed to a bearish breakdown.
Photo by Sergio Camalich on Unsplash
Price tags: xbtusd, btcusd, btcusdt
Charts from TradingView.com
This On-Chain Indicator Looks As It Did Prior to Bitcoin's 2017 Rally

Bitcoinist.com is author of this content, TheBitcoinNews.com is is not responsible for the content of external sites.
source: https://bitcoinist.com/this-on-chain-indicator-looks-as-it-did-prior-to-bitcoins-2017-rally/?utm_source=rss&utm_medium=rss&utm_campaign=this-on-chain-indicator-looks-as-it-did-prior-to-bitcoins-2017-rally
TheBitcoinNews.com is here for you 24/7 to keep you informed on everything crypto. Like what we do? Tip us some BAT
Send Tip now!