The Bitcoin network has recently crossed over the 18.5 million mark, as far as the number of bitcoins currently minted into circulation. However, even though over 18 million coins have been minted to-date there’s a number of different elements that affect the distribution of all the coins in existence. Elements that affect bitcoin distribution include large holders, lost coins, so-called sleeping coins, and coins held in custody for various solutions.
As of today, the outstanding circulating BTC supply is around 18,508,600 BTC, but during the last 12 months, many people have been discussing the actual distribution of the circulating supply. For example, in mid-September news.Bitcoin.com reported on an analyst who said only 14 million out of the 21 million supply cap will ever circulate.
Then follow us on Google News!
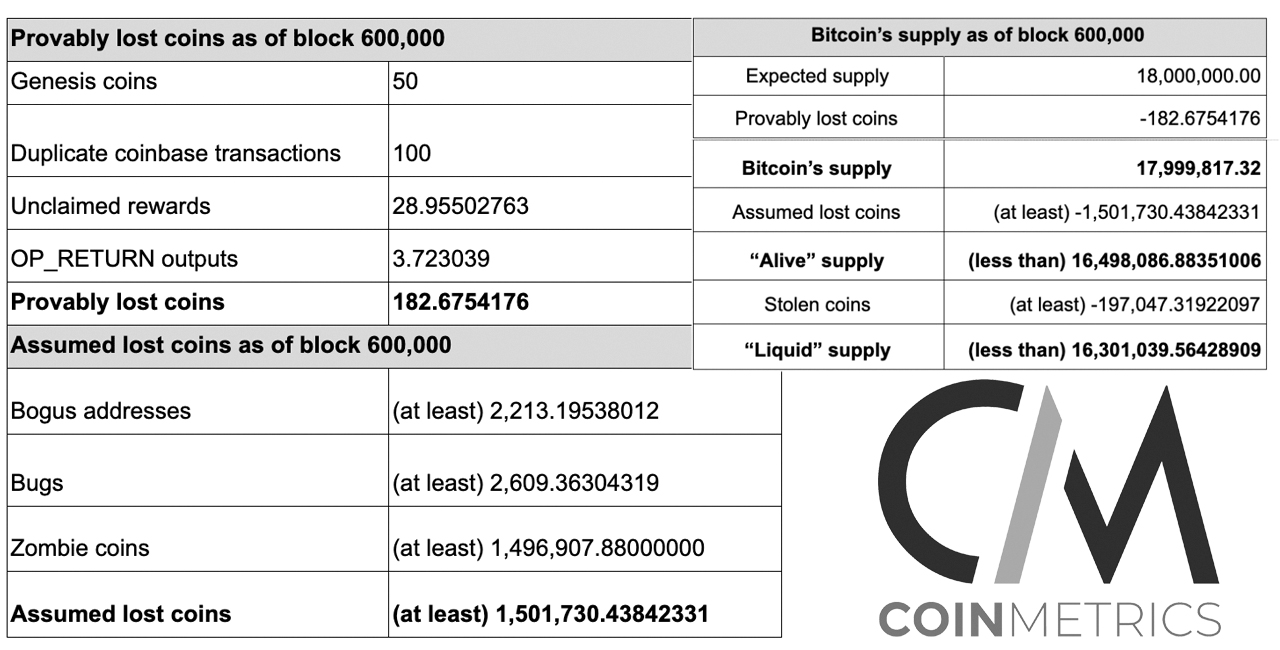
Last year, Coin Metrics also published an analysis, which discussed a variety of methods to assess Bitcoin’s true supply. At that time, as of block height 600,000, Coin Metric’s assessment of BTC’s “liquid” supply was around 16.3 million.

Just recently, the web portal Blockchaincenter.net published a massive visualization of Bitcoin’s circulating supply and distribution. The visual is quite large, but it shows how the existing supply of BTC is distributed among various entities and individuals. For instance, the graphic shows there’s 2.6 million BTC on exchanges, which accounts for 12% of the 21 million supply cap.
The visualization also estimates there are 1.5 million zombie coins or so-called sleeping bitcoins. Blockchaincenter’s graph shows over 328,000 coins are mined every year until the next halving as well.

Grayscale Investments Bitcoin Trust holds 450,000 BTC in reserves and that represents over 2.5% of the outstanding supply of bitcoins today. The chart also shows Microstrategy (38,250 BTC), the 120,000 BTC locked into Ethereum, and Tim Draper’s 30,000 BTC stash of old Silk Road coins.
The visualization also shows hacks (120k BTC Bitfinex 2016), the Plustoken scam coins (200k BTC), and the 166,000 BTC sitting in Mt Gox wallets today. Blockchaincenter’s graphic shows how the current circulating and non-circulating supply is distributed today with a unique visual perspective.
Bitcoin is quite scarce and only 2.5 million are left until 2140, which is the year the last block will be mined into existence. The network is also extremely difficult to mine with the network’s difficulty touching 19.22T and the hashrate around 140 exahash per second (EH/s).
Moreover, BTC will see a reward halving again on or around May 7, 2024 making the digital currency even more limited by design.
What do you think about Blockchaincenter’s visual graphic showing the circulating supply and distribution? Let us know what you think about this subject in the comments section below.
The post Visual Interpretation of Bitcoin’s Supply Shows the Digital Asset’s Unique Scarcity appeared first on Bitcoin News.

Bitcoin.com is author of this content, TheBitcoinNews.com is is not responsible for the content of external sites.
source: https://news.bitcoin.com/visual-interpretation-of-bitcoins-supply-shows-the-digital-assets-unique-scarcity/
TheBitcoinNews.com is here for you 24/7 to keep you informed on everything crypto. Like what we do? Tip us some BAT
Send Tip now!
