
Bitcoin price remained in a range above the $18,500 support against the US Dollar. BTC is trading above $19,000 and it could start a strong surge if there is a clear break above $19.3K
- Bitcoin is currently holding the $18,800 and $19,000 support levels.
- The price is facing a major resistance near $19,300, but it is above the 100 hourly simple moving average.
- There is a major contracting triangle forming with resistance near $19,300 on the hourly chart of the BTC/USD pair (data feed from Kraken).
- The pair could start a strong rally if there is a clear break above the $19,300 resistance zone.
Bitcoin Price is Stuck In Range
Yesterday, we discussed the importance of the 100 hourly simple moving average and $18,800 for bitcoin price. BTC did find a strong support near the 100 hourly simple moving average and there was no downside break below the $18,500 support.
The price seems to be trading in a broad range above the $18,500 and $18,800 support. The last swing low was formed near $18,117 before the price climbed above the 50% Fib retracement level of the key downward move from the $19,957 swing high to $18,117 swing low.
The price is now facing a major resistance near $19,300, but it is above the 100 hourly simple moving average. It seems like there is a major contracting triangle forming with resistance near $19,300 on the hourly chart of the BTC/USD pair.
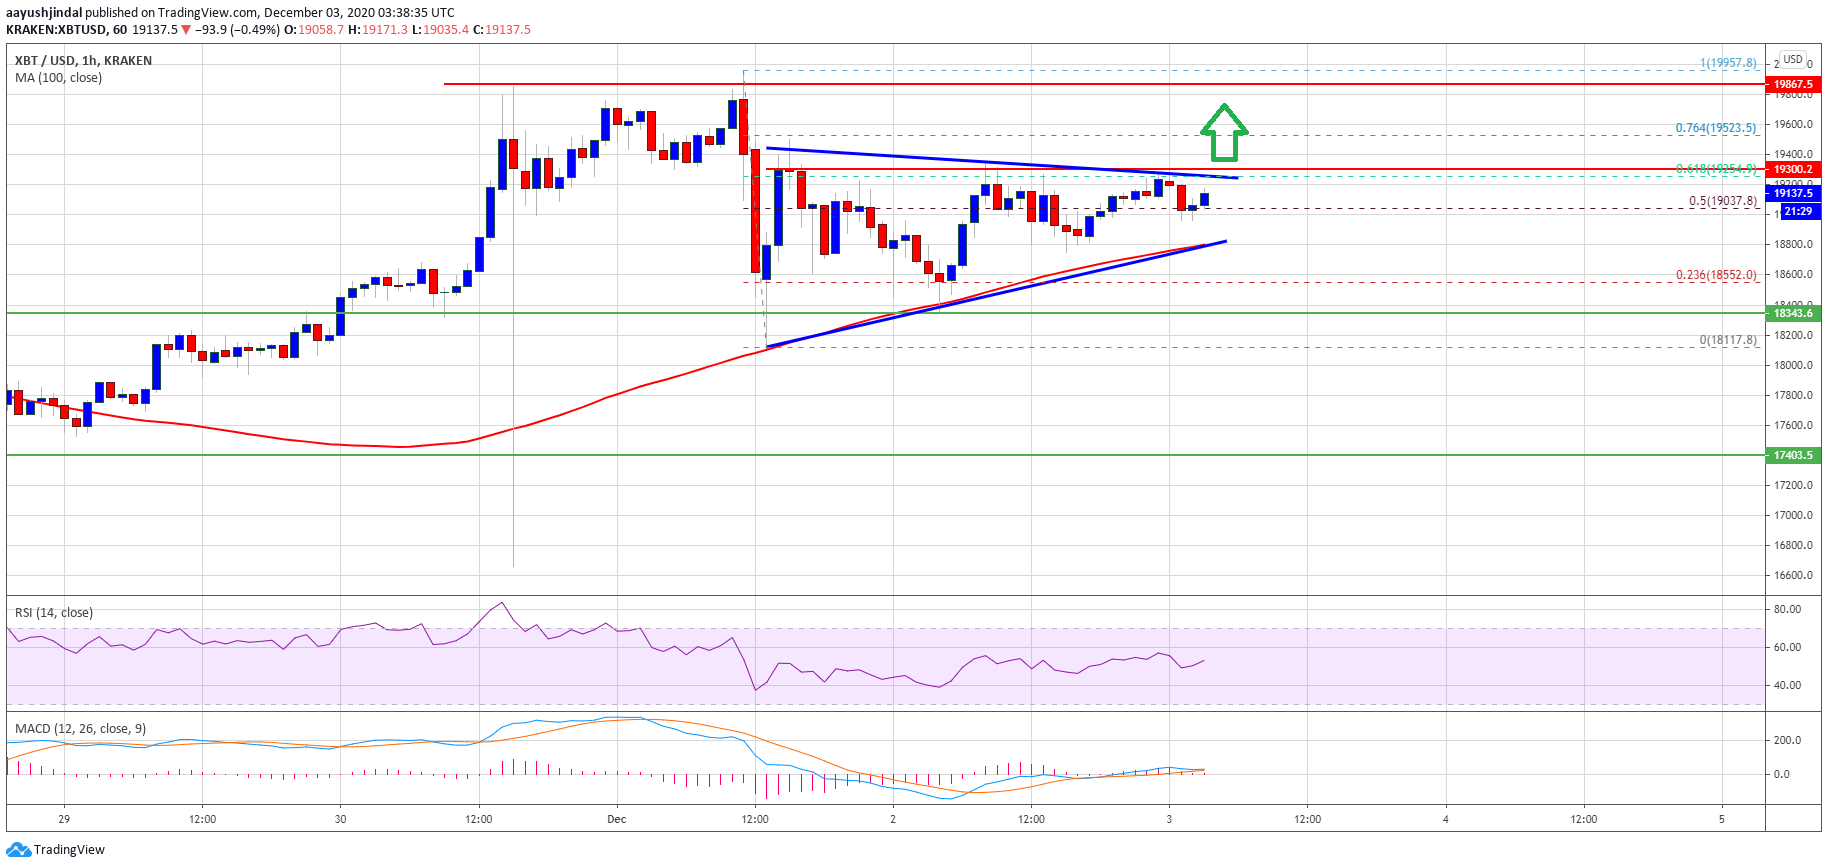
Source: BTCUSD on TradingView.com
The triangle resistance is close to the 61.8% Fib retracement level of the key downward move from the $19,957 swing high to $18,117 swing low.
Therefore, a close above the triangle resistance and $19,320 could open the doors for a larger increase. The next key resistance is near the $19,500, above which bitcoin might test the $20,000 zone.
Downside Break in BTC?
If bitcoin fails to clear the $19,300 resistance level, there is a risk of a downside break. An initial support is near the triangle lower trend line at $18,800 and the 100 hourly simple moving average.
A downside break below the $18,800 support level could push the price towards $18,500. Any more losses may possibly spark a sharp decline towards the $18,000 level.
Technical indicators:
Hourly MACD – The MACD is slowly gaining momentum in the bullish zone.
Hourly RSI (Relative Strength Index) – The RSI for BTC/USD is currently just above the 50 level.
Major Support Levels – $18,800, followed by $18,500.
Major Resistance Levels – $19,300, $19,500 and $19,800.