
Ethereum extended its rise above the $1,150 and $1,200 resistance levels against the US Dollar. ETH price is currently consolidating gains and it could rise further towards $1,280.
- Ethereum is following a bullish path above the $1,120 and $1,150 resistance levels.
- The price is now trading above $1,200 and the 100 hourly simple moving average.
- There is a key rising channel forming with support near $1,180 on the hourly chart of ETH/USD (data feed via Kraken).
- The pair is likely to continue higher if it remains stable above $1,180 and $1,150.
Ethereum Price Rallies 12%
After forming a support base above $1,100, Ethereum started a fresh increase. ETH price broke the $1,120 and $1,150 resistance levels to move further into a positive zone.
There was also a break above the $1,200 level and a close above the 100 hourly simple moving average. Ether price traded to a new multi-month high near $1,230 and it is currently consolidating gains. An initial support on the downside is near the $1,200 level.
It is close to the 23.6% Fib retracement level of the upward move from the $1,109 swing low to $1,230 high. There is also a key rising channel forming with support near $1,180 on the hourly chart of ETH/USD.
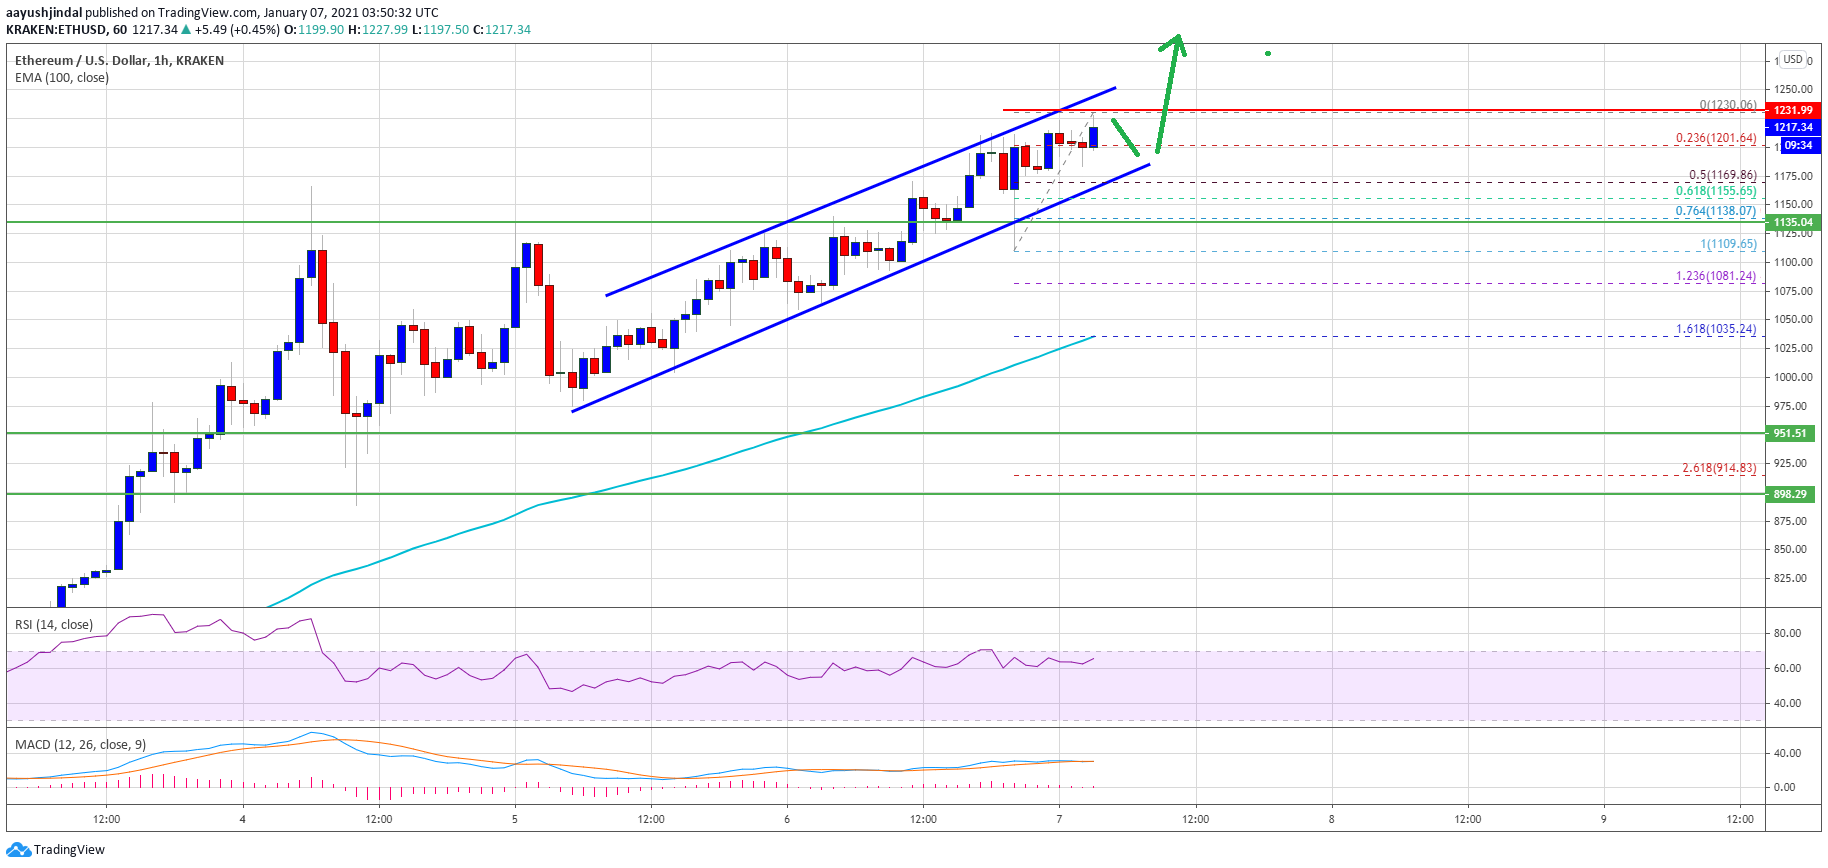
The channel support is close to the 50% Fib retracement level of the upward move from the $1,109 swing low to $1,230 high. On the upside, the $1,230 level is a minor resistance. A clear break above the $1,230 level could open the doors for a larger increase (similar to bitcoin).
In the stated case, the price could easily drift above the $1,250 level. The next key stop could be $1,300, above which it could test the $1,320 level in the near term.
Dips Limited in ETH?
If ethereum fails to clear the $1,230 and $1,250 resistance levels, it could start a short-term downside correction. An initial support on the downside is near the channel support and $1,180.
A downside break below the channel support trend line might lead ether price towards the $1,125 support zone 9a multi-touch zone). Any more losses might call for a test of the 100 hourly SMA at $1,035 in the coming sessions.
Technical Indicators
Hourly MACD – The MACD for ETH/USD is losing pace in the bullish zone.
Hourly RSI – The RSI for ETH/USD is currently well above the 60 level.
Major Support Level – $1,180
Major Resistance Level – $1,230