
As of 18:20 UTC, the bitcoin-to-dollar exchange rate was trading at $4,011, down 0.52-percent from the session high at $4,032. The marginal downside correction didn’t interrupt the market’s intraday bullish bias. However, the bitcoin surge came alongside declining volumes, which cast doubt on the uptrend’s durability in the medium-term.
Unfortunately for the bulls, the charts seem to favor the bears, as these three technical factors indicate.
Near-Term Ascending Channel Purges Trading Volume
BITCOIN IS TRENDING INSIDE AN ASCENDING CHANNEL | SOURCE: TRADINGVIEW.COM, COINBASE
The bitcoin price has been trending inside an ascending channel formation since February 14. Barring a false breakout action that sustained itself between February 18 and 24, bitcoin remained bound by the channel’s resistance and support trendlines. As we enter another day of trading, the cryptocurrency is merely repeating its recent price action, targeting the channel resistance for a potential breakout or a more likely pullback.
The primary reason we are not confident about the ongoing bullish action is declining volume. The inverse relationship between the bitcoin price and bitcoin volume indicates that the uptrend will not sustain for too long. We are currently above a critical level at $3,955 (red horizontal line) which has historically acted as decent support on a downtrend and resistance on an uptrend. Day traders should consider it while working on their strategies.
Resistance Bar Swats Down Bitcoin Price Rallies

STRONG RESISTANCE AREA CAPPING BITCOIN’S UPSIDE ATTEMPTS | SOURCE: TRADINGVIEW.COM, COINBASE
Another reason why the bitcoin uptrend could be growing weaker is a bearish divergence area defined by the $4,116-4,251 range. Ever since the November 2018 crash, bitcoin has attempted to break above the said resistance area on six different occasions. Assuming that the ongoing rally manages to invalidate the ascending channel resistance, it would still face a strong deviation sentiment at the blue bar in the chart above.
If bitcoin manages to break above the resistance area, it would still require a push above the 200-period moving average (in saffron) above to establish a strong bullish bias.
Giant Descending Trendline Adds More Pressure to Already-Weak Bitcoin Price
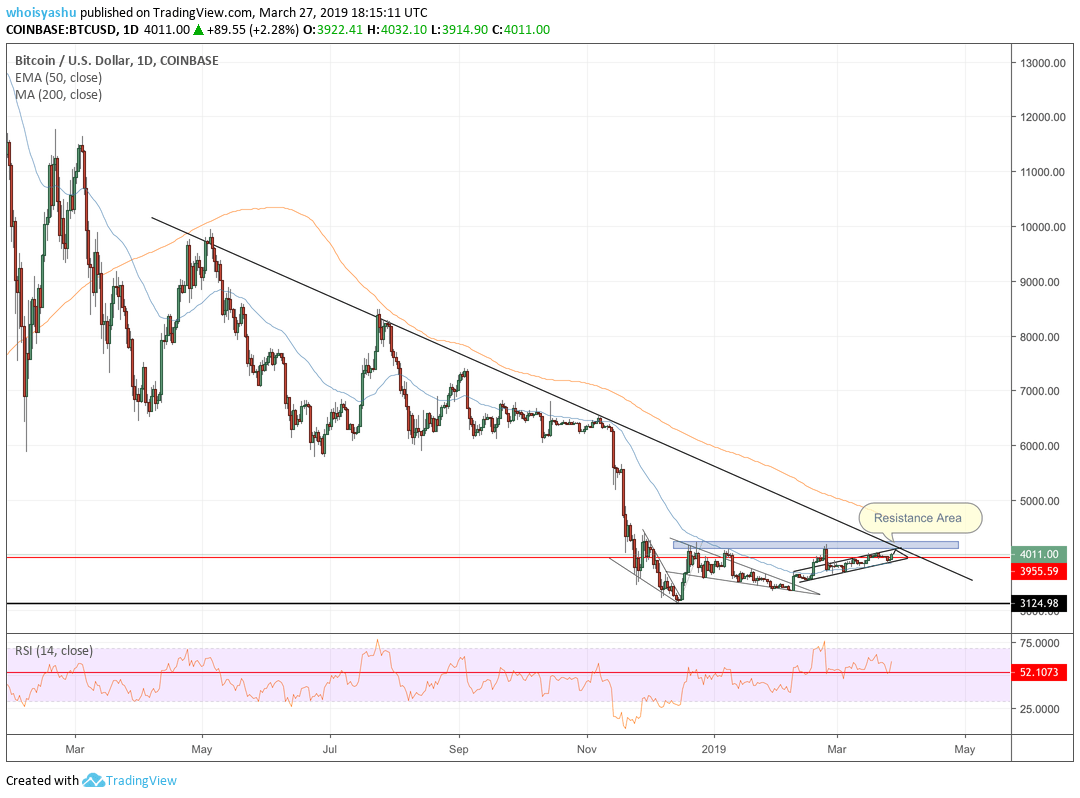
BITCOIN’S GIANT DESCENDING TRENDLINE | SOURCE: TRADINGVIEW.COM, COINBASE
The third and the last thing that is hinting at a huge bitcoin price reversal is the giant descending trendline in the chart above. The bearish indicator so far has stopped major upside moves from flourishing further. Bitcoin’s latest attempt to push above its interim ascending channel and an active resistance area would also need to battle the descending trendline – all at the same time.
Have a look at this zoomed version for a better look:

BITCOIN’S GIANT DESCENDING TRENDLINE | SOURCE: TRADINGVIEW.COM, COINBASE
The fact that these three anti-bullish indicators are converging amid declining trading volume suggests that bitcoin could have a difficult time slaying them all at once.