In the days leading up to the various bitcoin futures markets opening, bitcoin saw a push to fresh all-time highs near $20,000. However, shortly after reaching these values, the market saw a steady decline in price as demand dwindled and supply began to dominate the market. In the last bitcoin market analysis, we discussed a possible distribution phase for bitcoin and a potential hypodermic breakdown of the strong, parabolic trend the market has seen. Let’s take a look the latest developments:
Figure 1: BTC-USD, 1-Hour Candles, Distribution Update
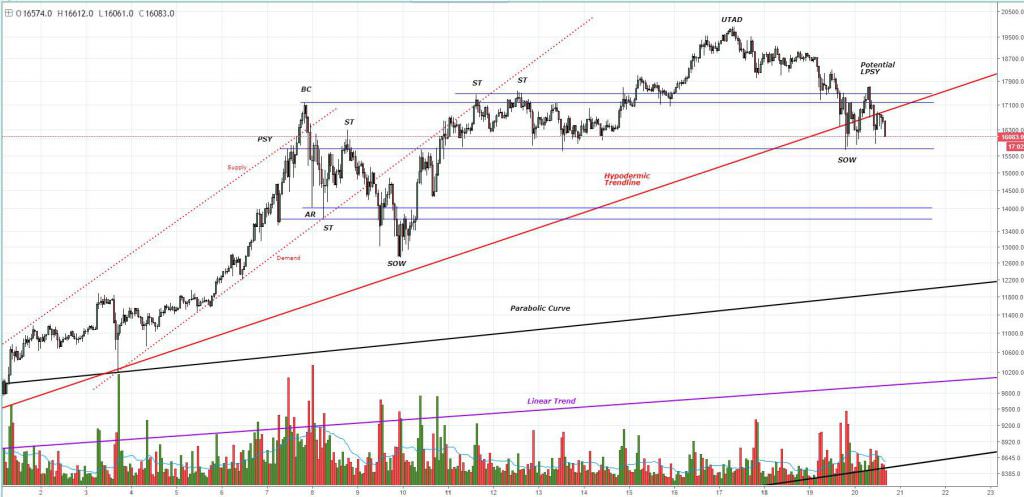
One troubling aspect of this current price trend is the high volume leading into all the dips, and the low volume on the price rises. This price action shows both the diminishing demand in the market and the overwhelming supply that is beginning to take dominance in the market. Currently, bitcoin is perched on a potential part of the trading range called “Last Point of Supply” (LPSY): this offers a final opportunity for the large players who have not exited the market to finally exit before an ultimate correction.
As discussed in the previous article, there is a strong, aggressive trend called the hypodermic trendline:
 Figure 2: BTC-USD, 4-Hour Candles, Hypodermic Trendline
The hypodermic trendline represents a break outside of the parabolic envelope that dominated the market trend for over three years. The hypodermic trend also represents an aggressive price trend that is fairly difficult to maintain because of the demand required to keep the price aloft.
Currently, the price is sitting below this trendline and has rejected its initial test of the trend. At the moment, BTC-USD is testing the support of the trading range (shown in blue) and is systematically going through support tests as the market finds new lows.
A breakdown of this hypodermic trend, and a possible breakdown of this trading range, could easily send the market down to test the parabolic curve (shown in black):
 Figure 3: BTC-USD, 1-Day Candles, Macro Trend
There is likely to be very strong support along the parabolic trend that will stifle any potential price drops. As always, it’s important to watch the volume with the price growth or drops to confirm the likely direction of a move. As we test new lows, any volume growth will likely signal a continuation of the downtrend and ultimately have us testing the lower boundaries of the trading range.
Summary:
-
Bitcoin is potentially at its Last Point of Supply as it begins to test new lows in its current downtrend.
-
Bitcoin broke below the hypodermic trendline, which usually signals a breakdown in trend.
-
Support will be found along the lower boundary of the trading range and will likely slow down any potential price drops.
Trading and investing in digital assets like bitcoin and ether is highly speculative and comes with many risks. This analysis is for informational purposes and should not be considered investment advice. Statements and financial information on Bitcoin Magazine and BTC Media related sites do not necessarily reflect the opinion of BTC Media and should not be construed as an endorsement or recommendation to buy, sell or hold. Past performance is not necessarily indicative of future results.