
As Bitcoin finally breaks $50k, on-chain data shows BTC indicators look similar to the rally that lead to the ATH earlier in the year.
Bitcoin Indicators May Suggest A Repeat Of The ATH Rally From Earlier In 2021
As pointed out by a CryptoQuant post, the derivative exchanges’ reserve has been going down, while the funding rate has been turning slightly positive.
This means these indicators are now gradually recovering from the May crash, and the trends at the moment look similar to the pre-bull run buildup.
The derivatives exchanges‘ reserve is an indicator that shows the total amount of Bitcoin present in derivative exchange wallets.
These derivatives platforms are different from spot exchanges in that they offer services like futures contract trading.
Related Reading | South African Man Loses $900,000 Worth Of Bitcoin After Accidentally Deleting Keys
An increase in the value of this metric implies more investors are sending their BTC to these exchanges for selling purposes. In such a case, there may be a selling pressure present in the market. Similarly, a positive value might mean there is a buying pressure in the market.
Here is the latest chart for the Bitcoin derivative exchanges’ reserve:
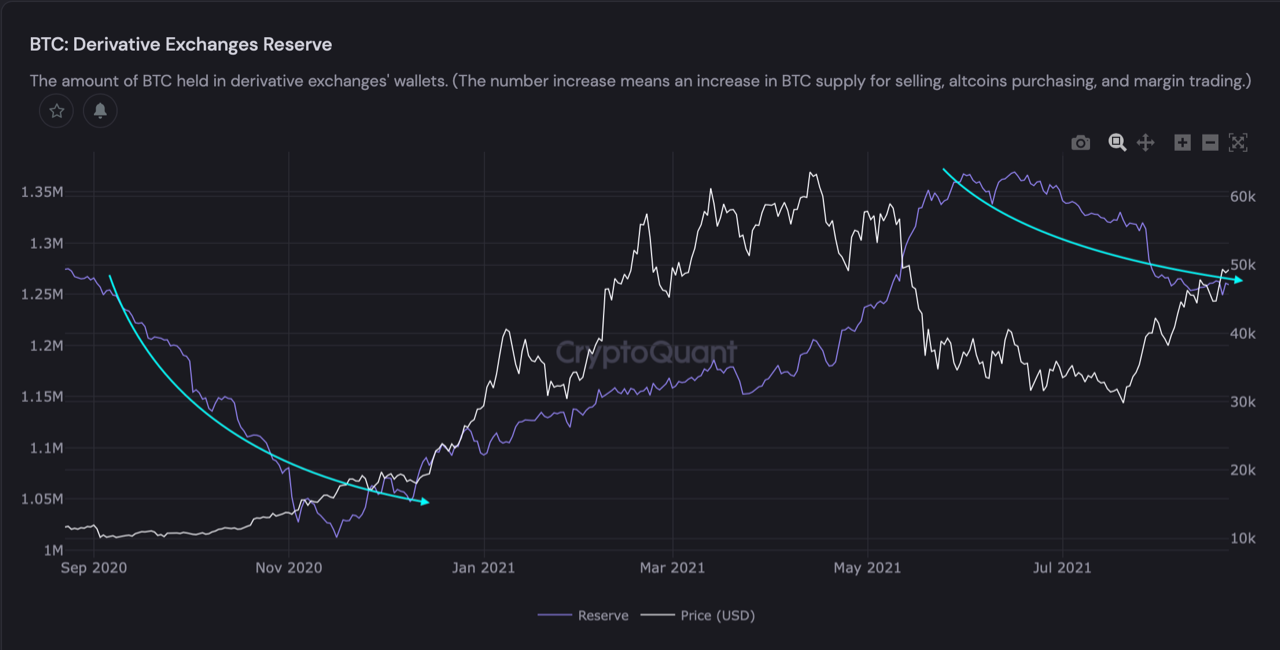
The value of the indicator seems to be heading downwards
As the above graph shows, the indicator’s value has been slowly moving on a downtrend as it recovers to values seen before the May crash.
The chart also highlights that this downtrend right now looks to be similar to the one seen before the start of the bull run.
Related Reading | Crypto Market Goes Into “Extreme Greed,” What This Means For Bitcoin
The other important indicator here is the Bitcoin funding rate. This metric shows the fees derivatives traders need to pay in order to keep their positions open. The below chart will reveal its current trend:
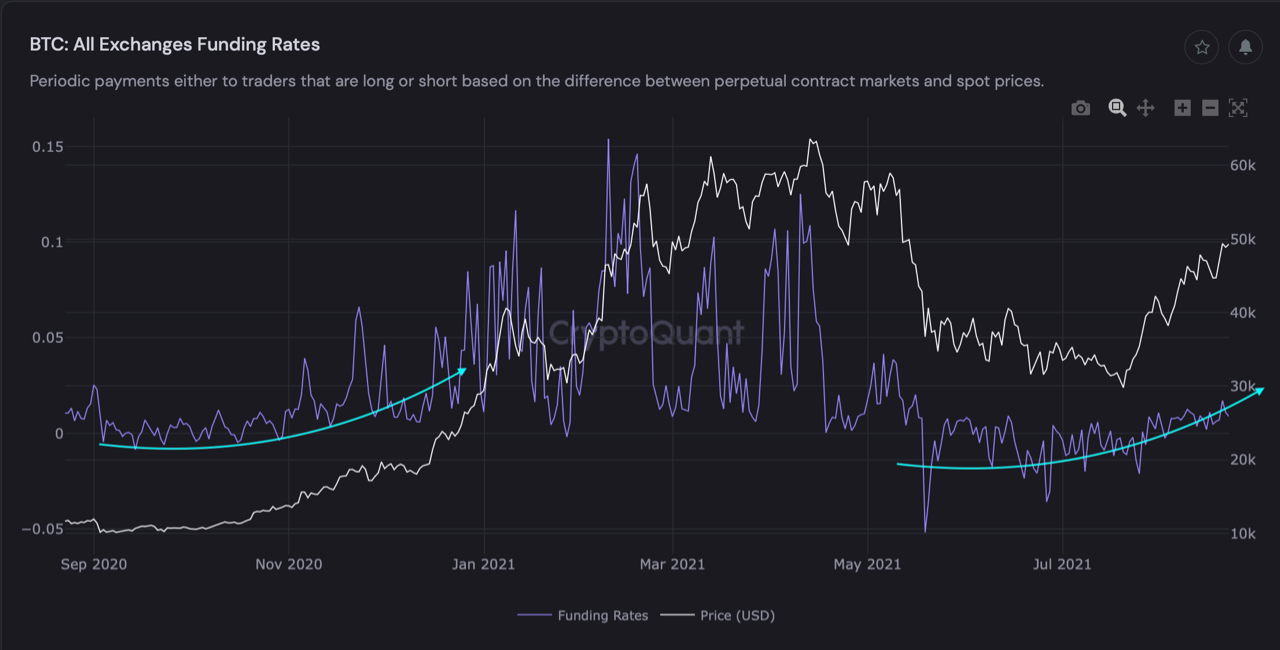
The funding rate has started to turn slightly positive
This indicator’s curve also looks to be similar to the trend seen during the period leading up to the 2021 bull run.
A positive funding rate like right now means long traders have to pay a premium to keep their positions, implying a bullish sentiment among the market.
BTC Price
At the time of writing, Bitcoin’s price floats around $50.2k, up 8% in the last 7 days. Over the past month, the value of the cryptocurrency has increased by 48%.
Below is a chart showing the trend in the price of the coin over the past three months:

Bitcoin finally breaks $50k | Source: BTCUSD on TradingView
It’s unclear at the moment whether BTC can keep the momentum up, but if the above indicators are to be believed, signs seem to be bullish for the cryptocurrency.
Featured image from Unsplash.com, charts from CryptoQuant, TradingView.com