
Binance coin price is up over 7% and it is outperforming bitcoin against the USDT. BNB could rally further if it clears the $35.50 resistance zone in the near term.
- Binance coin price is gaining bullish momentum above the $32.00 resistance against the USDT.
- The price is testing a major hurdle near $35.50 and the previous swing high.
- There was a break above a crucial bearish trend line with resistance near $28.00 on the 4-hours chart of the BNB/USDT pair (data source from Binance).
- Bitcoin price is consolidating above $23,000 and it could continue to rise.
Binance Coin Price Showing Positive Signs
In the past few days, bitcoin, Ethereum, ripple, and binance coin started a sharp increase. BNB price formed a support base near $26.60 before starting a strong increase.
There was a break above a crucial bearish trend line with resistance near $28.00 on the 4-hours chart of the BNB/USDT pair. The pair gained pace above the $30.00 level and the 100 simple moving average (4-hours). There was also a break above the 61.8% Fib retracement level of the downward move from the $35.49 high to $26.67 low.
BNB is now trading above the $35.00 level, with a bullish angle. It is now testing a major resistance near $35.50 and the previous swing high.
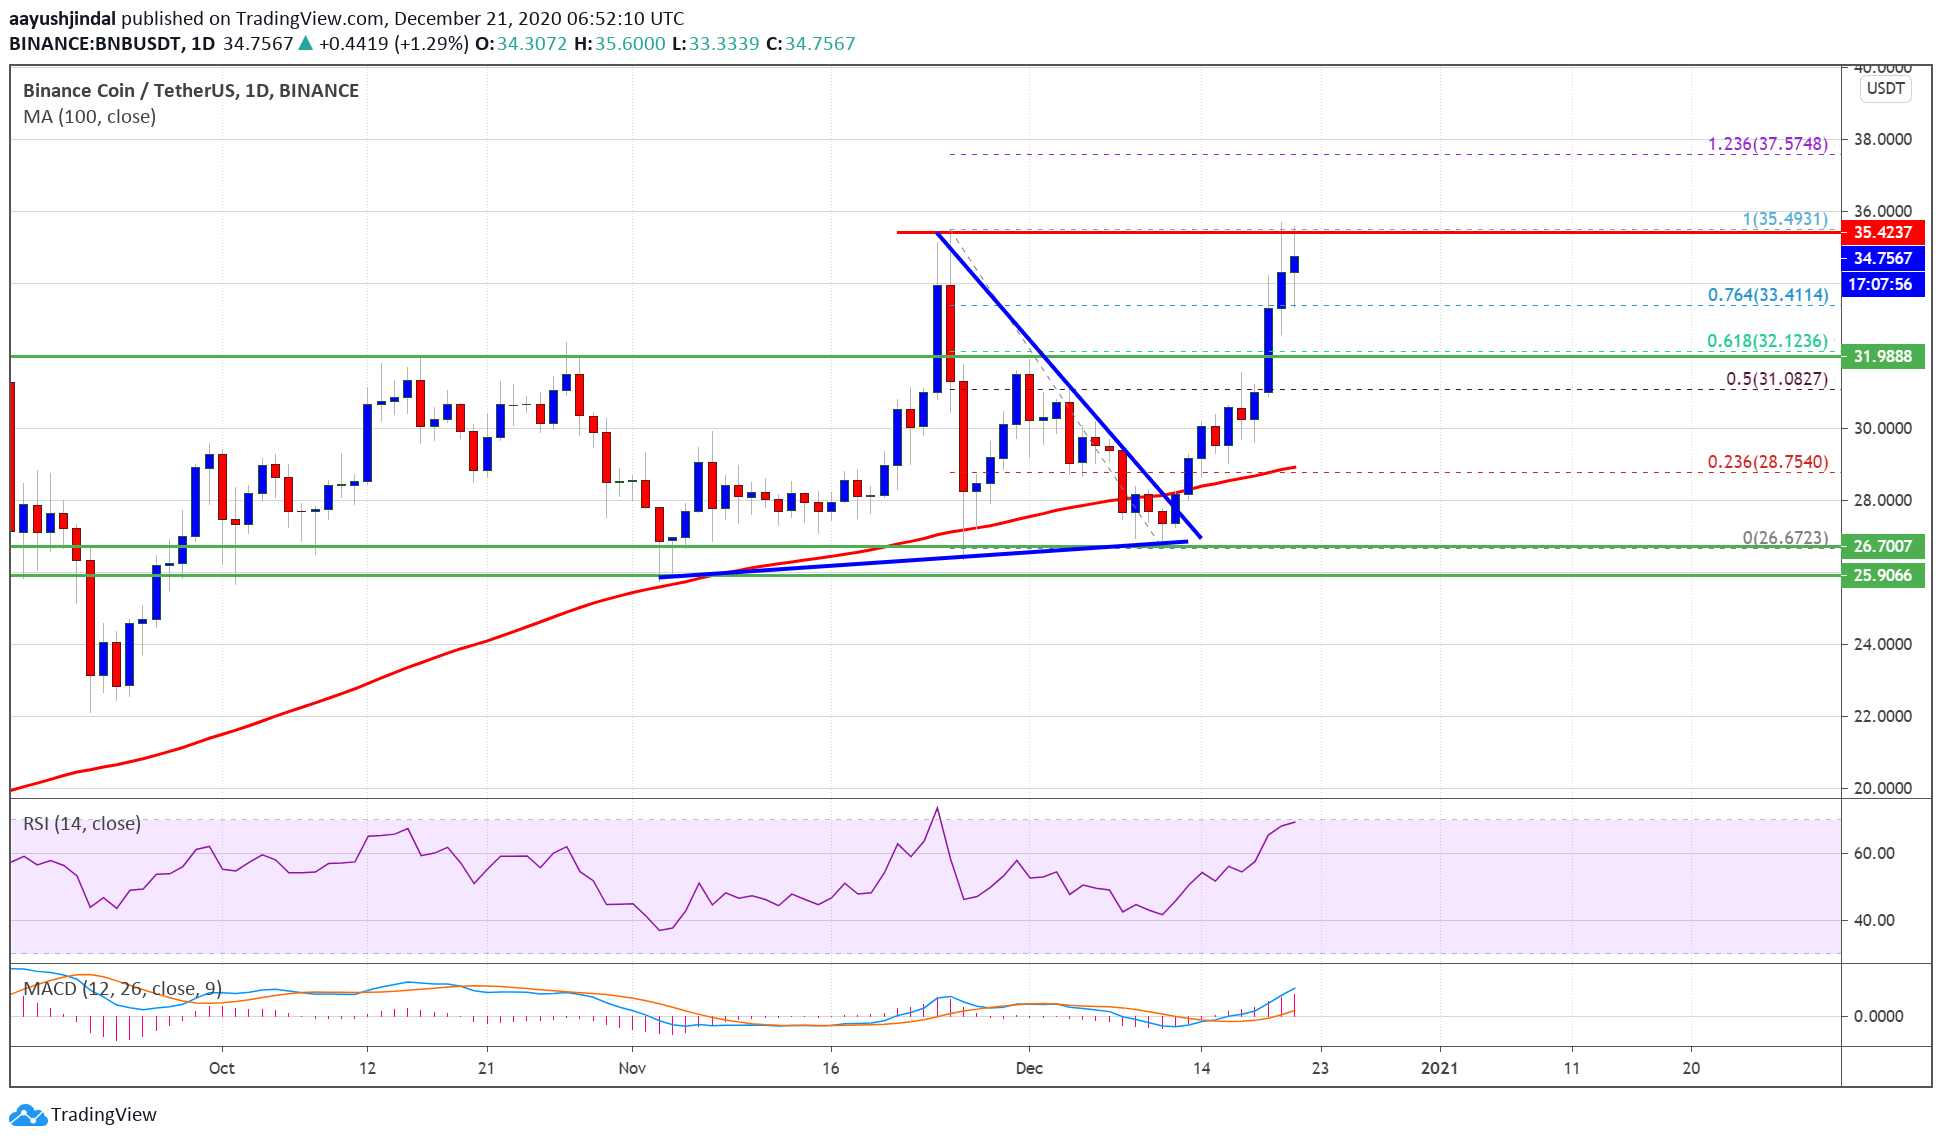
Source: BNBUSDT on TradingView.com
If there is a clear break above the $35.50 resistance, there could be a sharp increase. The next major resistance is near the $37.50 level. It is close to the 1.236 Fib extension level of the downward move from the $35.49 high to $26.67 low.
The next major stop for the bulls could be near the $40.00 level. Any more upsides might be limited in the short term unless bitcoin clears the $25,000 level.
Dips Supported in BNB
If BNB fails to clear the $35.50 and $35.60 resistance levels, it could start a downside correction. An initial support is near the $34.50 level.
The first major support is near the $32.00 level, below which the price might extend its decline. In the stated case, the price could revisit the $30.00 support zone.
Technical Indicators
4-Hours MACD – The MACD for BNB/USDT is gaining momentum in the bullish zone.
4-Hours RSI (Relative Strength Index) – The RSI for BNB/USDT is currently well above the 50 level.
Major Support Levels – $34.50, $32.50 and $32.00.
Major Resistance Levels – $35.50, $37.50 and $40.00.