
Bitcoin price started a downside correction from the $52,750 all-time high against the US Dollar. BTC is now approaching a couple of important supports near $50,500.
- Bitcoin topped near the $52,750 level and started a downside correction.
- The price is still well above $50,000 and the 100 hourly simple moving average.
- There is a major bullish trend line forming with support near $50,400 on the hourly chart of the BTC/USD pair (data feed from Kraken).
- The pair is likely to bounce back from $50,400 or $50,000 in the coming sessions.
Bitcoin Price is Correcting Gains
After setting a new all-time high near $52,750, bitcoin price started a downside correction. BTC broke the $52,000 support level to move into a short-term bearish zone.
There was a break below the 23.6% Fib retracement level of the upward move from the $47,843 swing low to $52,750 high. It is now approaching a couple of important supports near the $50,500 level.
More importantly, bitcoin is still well above $50,000 and the 100 hourly simple moving average. There is also a major bullish trend line forming with support near $50,400 on the hourly chart of the BTC/USD pair. The next major support is near the $50,320 level.
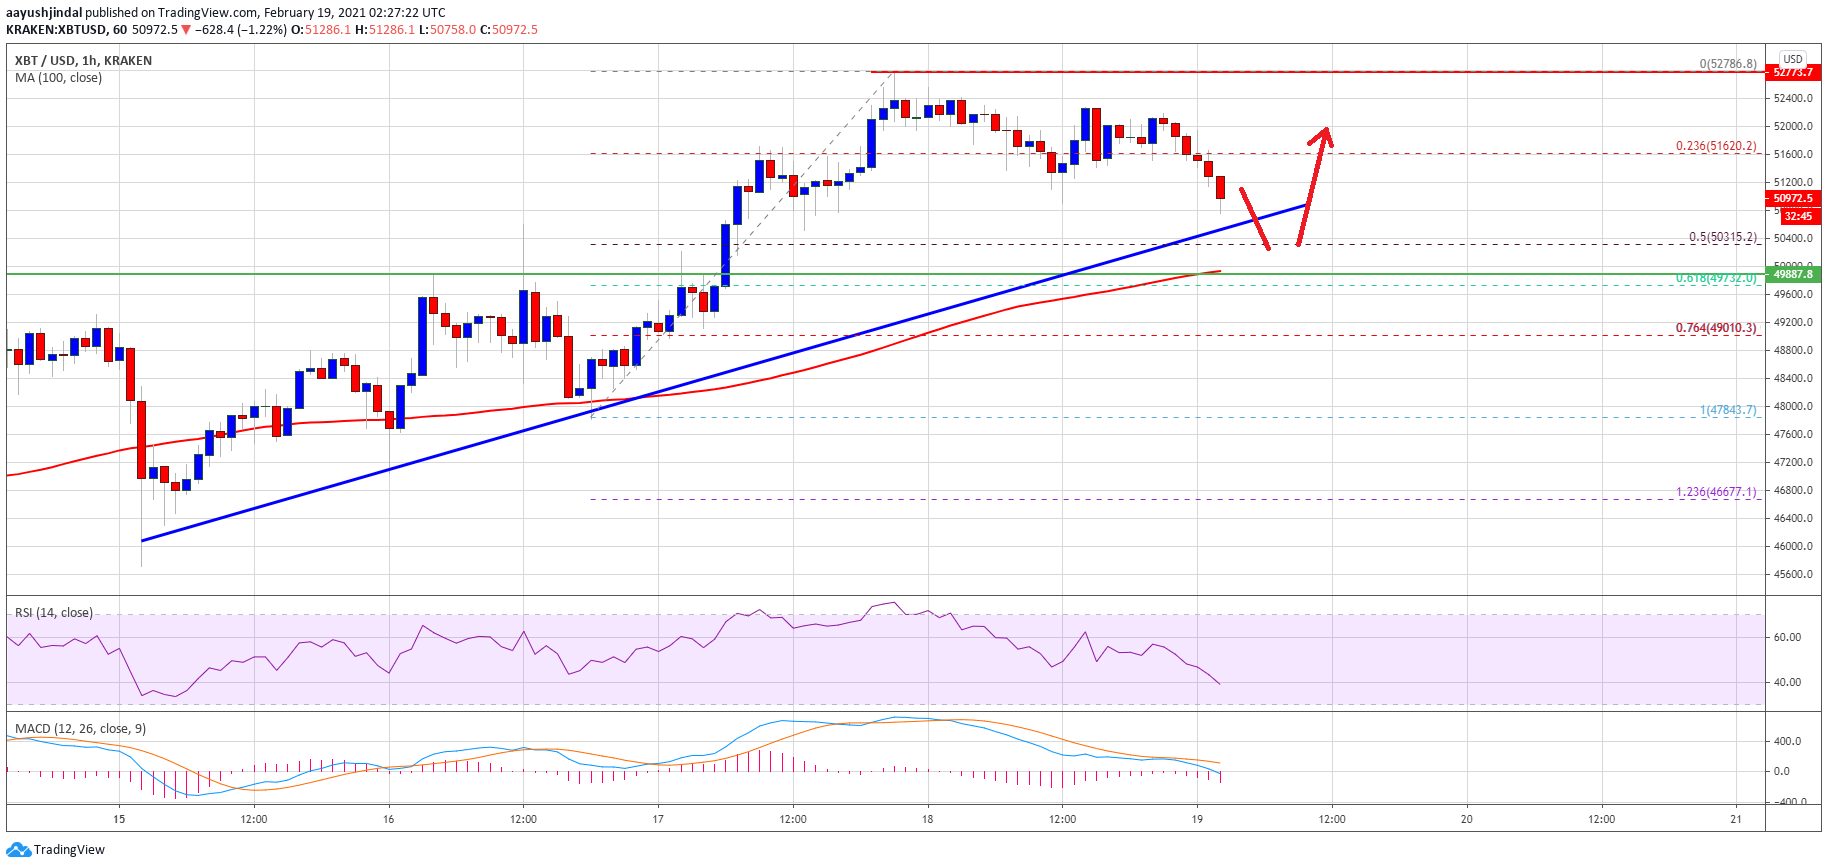
Source: BTCUSD on TradingView.com
The 50% Fib retracement level of the upward move from the $47,843 swing low to $52,750 high is near the $50,320 level to provide support. The main support is forming near $50,000 and the 100 hourly simple moving average. Any more losses may possibly start a steady decline towards the $48,000 support zone. Any more losses might call for a test of the key $45,000 support level.
Fresh Increase in BTC?
If bitcoin remains stable above the $50,500 and $50,000 support levels, it could start a fresh increase. An initial resistance on the upside is near the $51,500 level.
The first major resistance is near the $52,000 level, above which the price is likely to accelerate higher towards the $52,750 high. If the price gains pace above $52,500 and $52,750, there are high chances of an upside break above the $53,500 level in the coming sessions.
Technical indicators:
Hourly MACD – The MACD is slowly gaining momentum in the bearish zone.
Hourly RSI (Relative Strength Index) – The RSI for BTC/USD is now well below the 50 level.
Major Support Levels – $50,500, followed by $50,000.
Major Resistance Levels – $51,500, $52,000 and $52,750.