
Bitcoin price gained bullish momentum above the $57,000 resistance against the US Dollar. BTC is now trading nicely above $58,000 and it is likely to continue higher.
- Bitcoin is up over 5% and it broke the key $58,000 resistance level.
- The price is now well above the $58,000 resistance and the 100 hourly simple moving average.
- There was a break above a major bearish trend line with resistance near $57,500 on the hourly chart of the BTC/USD pair (data feed from Kraken).
- The pair is likely to continue higher towards the $60,000 and $60,500 levels in the near term.
Bitcoin Price is Gaining Momentum
After forming a base above $55,000, bitcoin started a fresh increase. BTC broke many hurdles near $57,000 and $58,000 (as discussed yesterday) to move into a positive zone.
There was a break above a major bearish trend line with resistance near $57,500 on the hourly chart of the BTC/USD pair. The pair even broke the 61.8% Fib retracement level of the key decline from the $61,695 high to $53,220 low.
It opened the doors for more gains and the price even climbed above $59,000. A high is formed near $59,623, and the price is now well above the $58,000 resistance and the 100 hourly simple moving average.
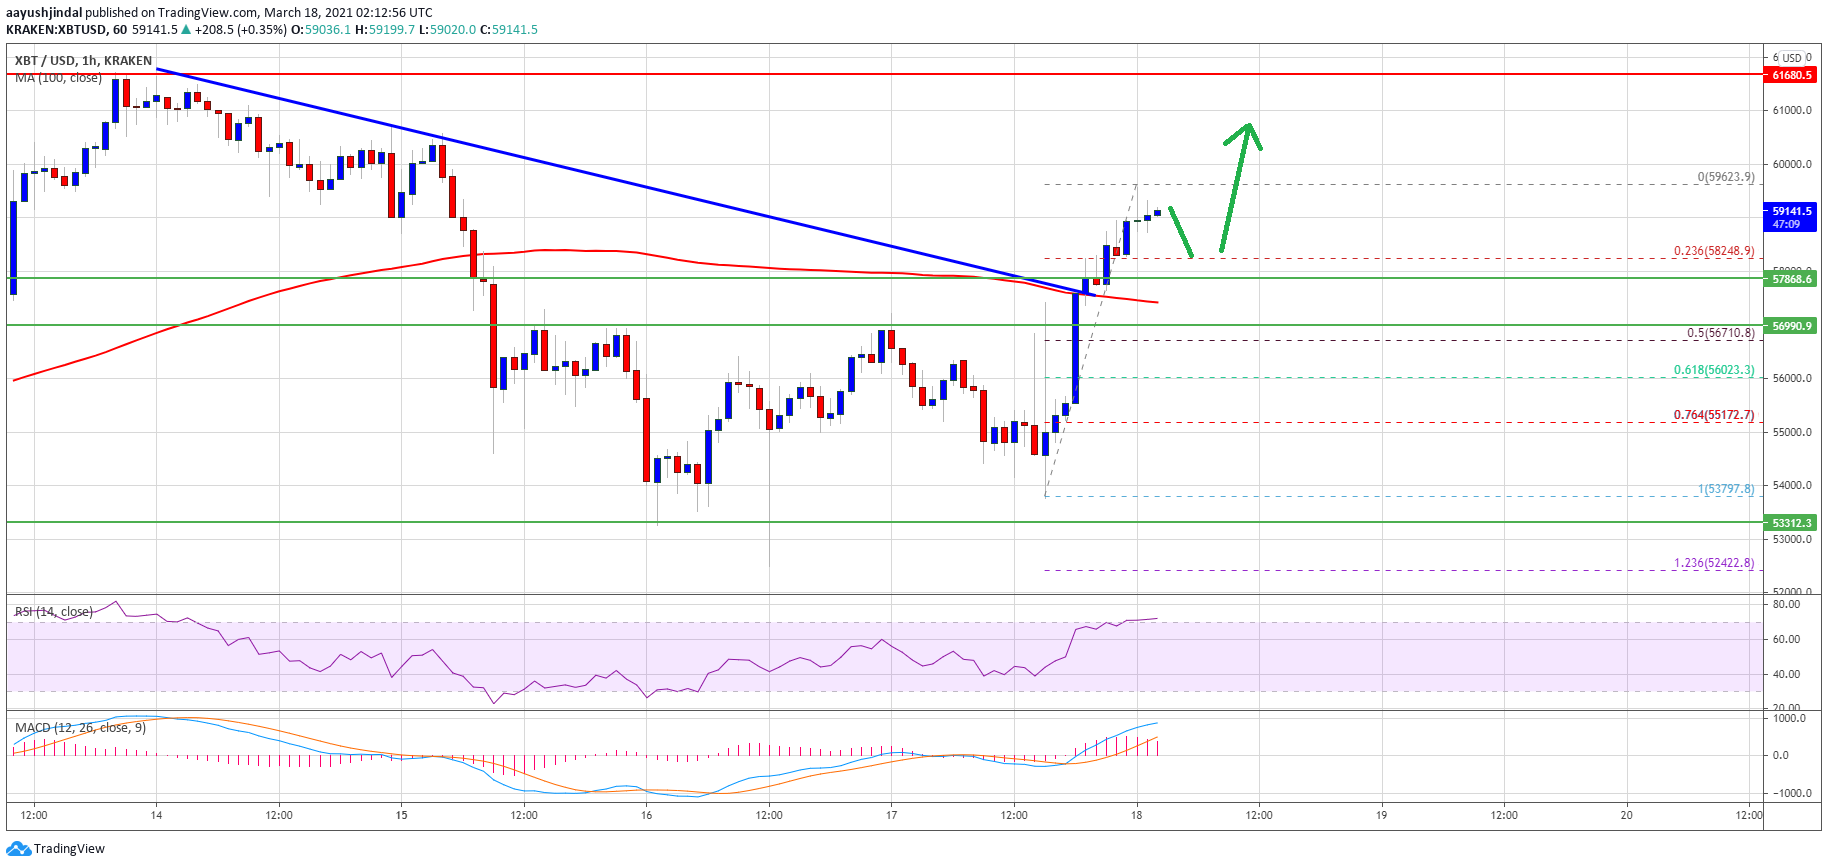
Source: BTCUSD on TradingView.com
An initial support is near the $58,250 level. It is close to the 23.6% Fib retracement level of the recent increase from the $53,797 swing low to $59,623 high. On the upside, the price is facing resistance near the $59,500 level. The next key resistance is near the $60,000 level. A clear close above the $60,000 level could open the doors for a larger increase towards $61,500 in the near term.
Fresh Dip in BTC?
If bitcoin fails to continue higher above the $60,000 resistance, it could start a fresh decline. The first key support on the downside is near the $57,500 level.
The main support is now forming near the $57,000 level and the 100 hourly simple moving average. Any more losses might call for a test of the $55,000 support zone in the coming sessions.
Technical indicators:
Hourly MACD – The MACD is now gaining momentum in the bullish zone.
Hourly RSI (Relative Strength Index) – The RSI for BTC/USD is now well above the 50 level.
Major Support Levels – $57,500, followed by $57,000.
Major Resistance Levels – $59,500, $60,000 and $61,500.