
Bitcoin price extended its decline below $31,000 and $30,000 against the US Dollar. BTC is correcting higher and it seems like the bulls are aiming a break above $32,000.
- Bitcoin declined below the $32,000 support level and revisited the $29,250 zone.
- The price is currently recovering above $30,000, but it is well below the 100 hourly simple moving average.
- There is a key bearish trend line forming with resistance near $31,350 on the hourly chart of the BTC/USD pair (data feed from Kraken).
- The pair could correct towards $32,000 or $32,800 if it clears the trend line resistance.
Bitcoin Price Is Attempting Strong Recovery
As discussed yesterday, bitcoin price did extend its decline and traded below the $32,000 support. BTC even broke the $31,000 level and settled below the 100 hourly simple moving average.
There was a clear break below the $30,000 support zone and the price tested $28,250. A low is formed near $29,271 and the price is currently correcting higher. It surpassed the $30,000 and $30,200 resistance levels.
There was a break above the 23.6% Fib retracement level of the downward wave from the $34,915 high to $29,271 low. However, the price is now facing resistance near $31,200 and $31,300. There is also a key bearish trend line forming with resistance near $31,350 on the hourly chart of the BTC/USD pair.
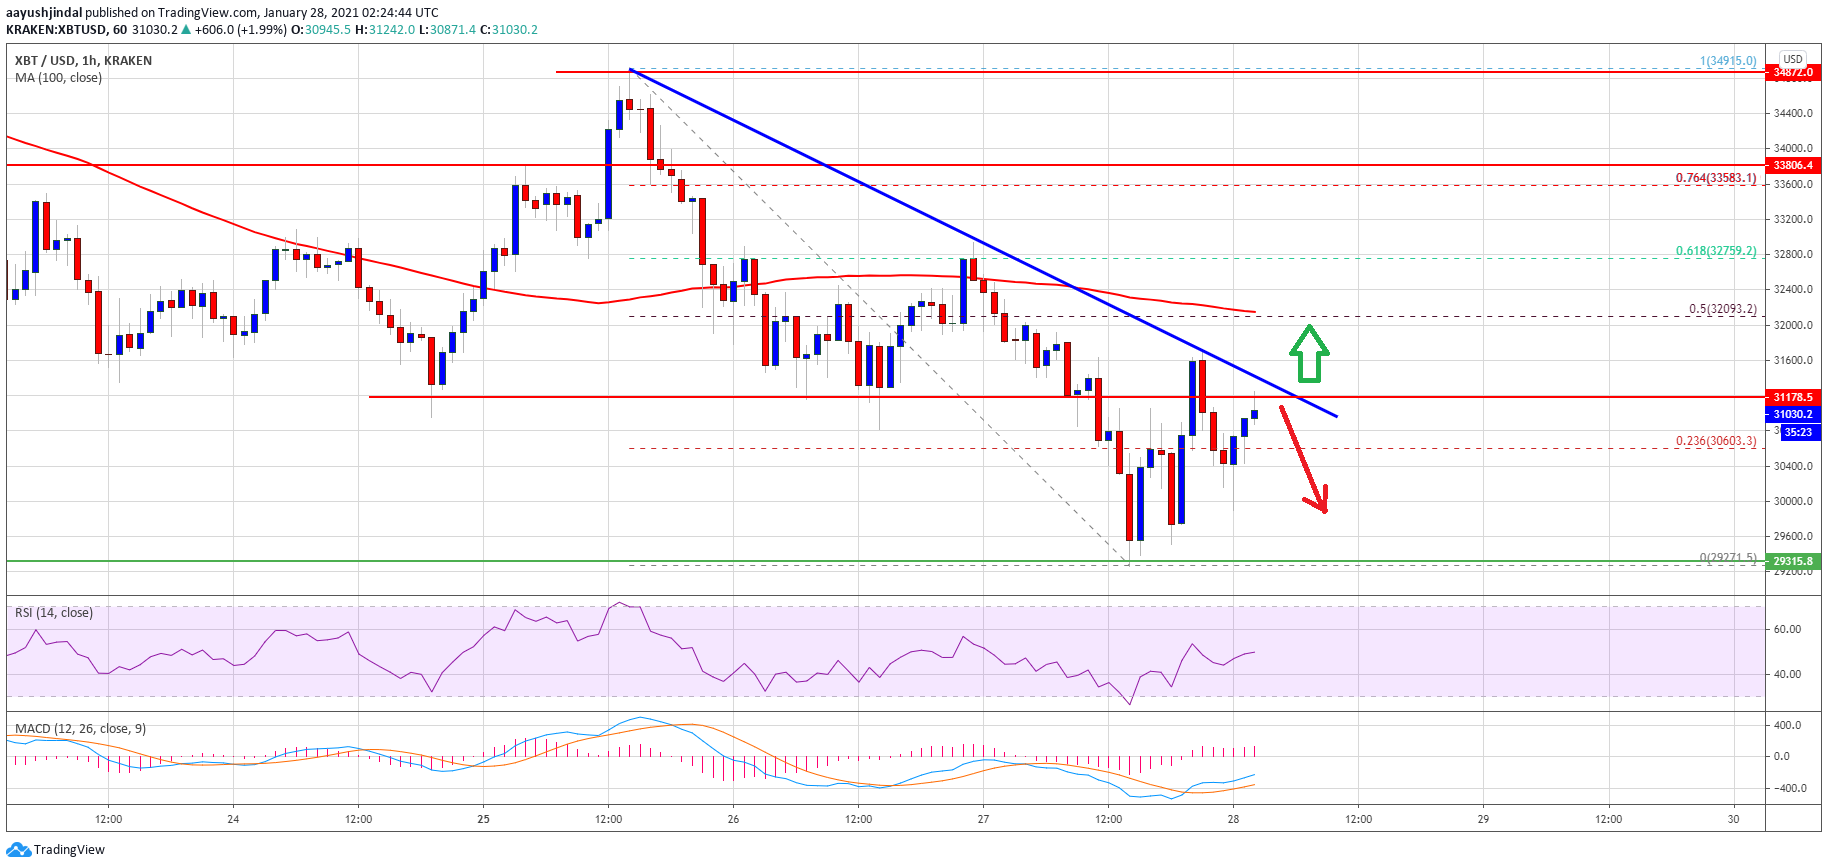
Source: BTCUSD on TradingView.com
If there is a clear break above the trend line resistance, bitcoin price could recover towards the $32,000 resistance. The 50% Fib retracement level of the downward wave from the $34,915 high to $29,271 low is also near the $32,000 level along with the 100 hourly SMA.
A successful break above the $32,000 resistance and the 100 hourly SMA could open the doors for a strong increase. The next major resistance is near the $32,800 and $33,000 levels.
Fresh Dip in BTC?
If bitcoin fails to clear the $31,300 resistance or $32,000, it could start a fresh decline. An initial support is near the channel support at $30,000.
The main support is now forming near the $29,250 zone. A clear break below the $29,250 support zone could open the doors for a larger decline towards $28K.
Technical indicators:
Hourly MACD – The MACD is slowly gaining pace in the bullish zone.
Hourly RSI (Relative Strength Index) – The RSI for BTC/USD is now above the 50 level.
Major Support Levels – $30,400, followed by $30,000.
Major Resistance Levels – $31,300, $32,000 and $32,800.