
Bitcoin price started a downside correction from the $38,000 resistance against the US Dollar. BTC is holding the $36,000 support and it could rise again in the near term.
- Bitcoin extended its rise and it even cleared the $38,000 resistance (as discussed yesterday).
- The price is still trading above $36,375 and the 100 hourly simple moving average.
- There is a major contracting triangle forming with support near $37,350 and $36,000 on the hourly chart of the BTC/USD pair (data feed from Kraken).
- The pair is likely to break the triangle resistance at $37,500 to start a fresh increase.
Bitcoin Price Holding Key Support
After trading above the $38,500 level, bitcoin price started a downside correction. BTC failed to stay above the $38,000 level and it even broke the $37,500 support level.
The price even broke the $37,000 level, but the bulls were active above the $36,000 level. A low is formed near $36,220 and the price is currently consolidating in a range. It climbed above the 23.6% Fib retracement level recent decline from the $38,716 high to $36,220 low.
Bitcoin is still trading above $36,375 and the 100 hourly simple moving average. There is also a major contracting triangle forming with support near $37,350 and $36,000 on the hourly chart of the BTC/USD pair.
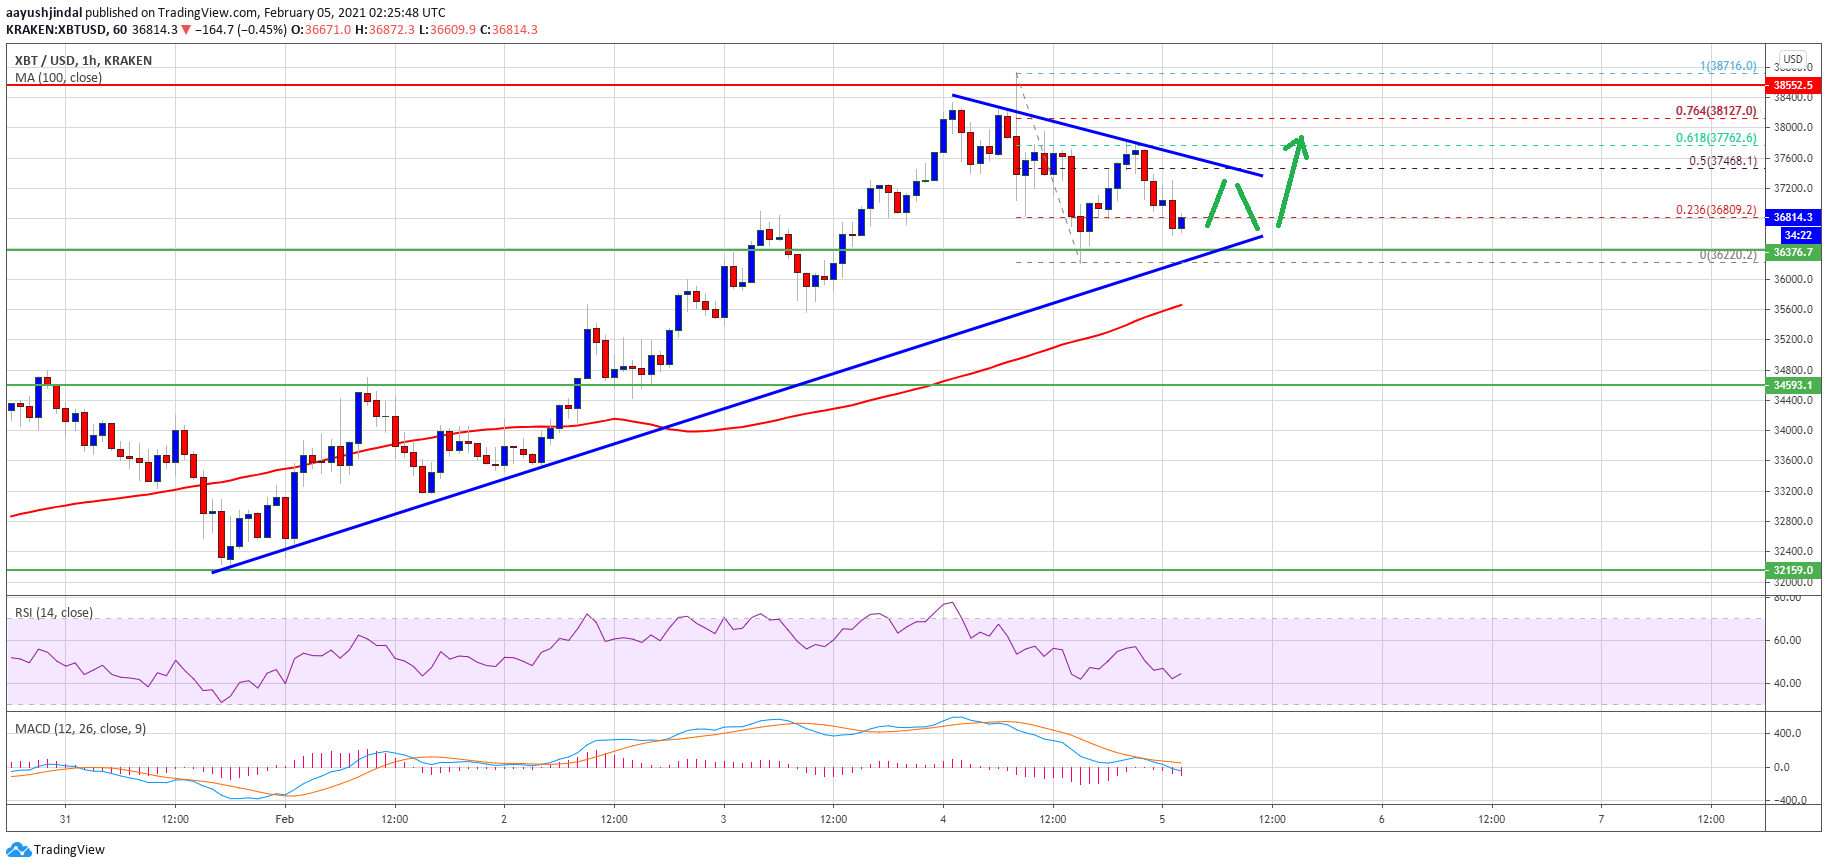
Source: BTCUSD on TradingView.com
The triangle resistance is near the $37,500 level. It is close to the 50% Fib retracement level recent decline from the $38,716 high to $36,220 low. If there is a clear break above the triangle resistance and $37,500, there are chances of a steady increase.
The next major resistance is near the $38,000 level. A successful close above the $38,000 level could set the pace for a move towards the $38,800 and $39,000 levels.
Downside Break in BTC?
If bitcoin fails to clear the $37,500 resistance and the triangle upper trend line, it could continue to move down. The first key support is near the triangle lower trend line at $36,350.
The next key support is near the $36,000 level, below which the price might test the 100 hourly SMA. Any more losses could lead the price towards the $35,000 support in the near term.
Technical indicators:
Hourly MACD – The MACD is gaining momentum in the bearish zone.
Hourly RSI (Relative Strength Index) – The RSI for BTC/USD is now just below the 50 level.
Major Support Levels – $36,350, followed by $36,000.
Major Resistance Levels – $37,500, $38,000 and $38,800.