
Bitcoin price extended its rise above the $55,000 resistance against the US Dollar. BTC is correcting lower from $55,800 and it could find bids near the $52,500 zone.
- Bitcoin climbed further above the $54,500 and $55,000 resistance levels.
- The price is now trading well above $52,500 and the 100 hourly simple moving average.
- There is a key bullish trend line forming with support near $52,500 on the hourly chart of the BTC/USD pair (data feed from Kraken).
- The pair is currently correcting gains, but it is likely to find support near $52,500 and $52,000.
Bitcoin Price Remains Elevated
There was an upside extension in bitcoin above the $54,500 resistance zone. BTC even cleared the $55,000 resistance and settled well above the 100 hourly simple moving average.
It tested the $55,800 resistance zone before the bears appeared. A high is formed near $55,805 and the price is currently correcting lower. It traded below the 23.6% Fib retracement level of the recent increase from the $49,375 low to $55,805 high.
Bitcoin is testing the $53,500 support level and it is still well above the 100 hourly simple moving average. The next major support is near the $52,500 level. There is also a key bullish trend line forming with support near $52,500 on the hourly chart of the BTC/USD pair.
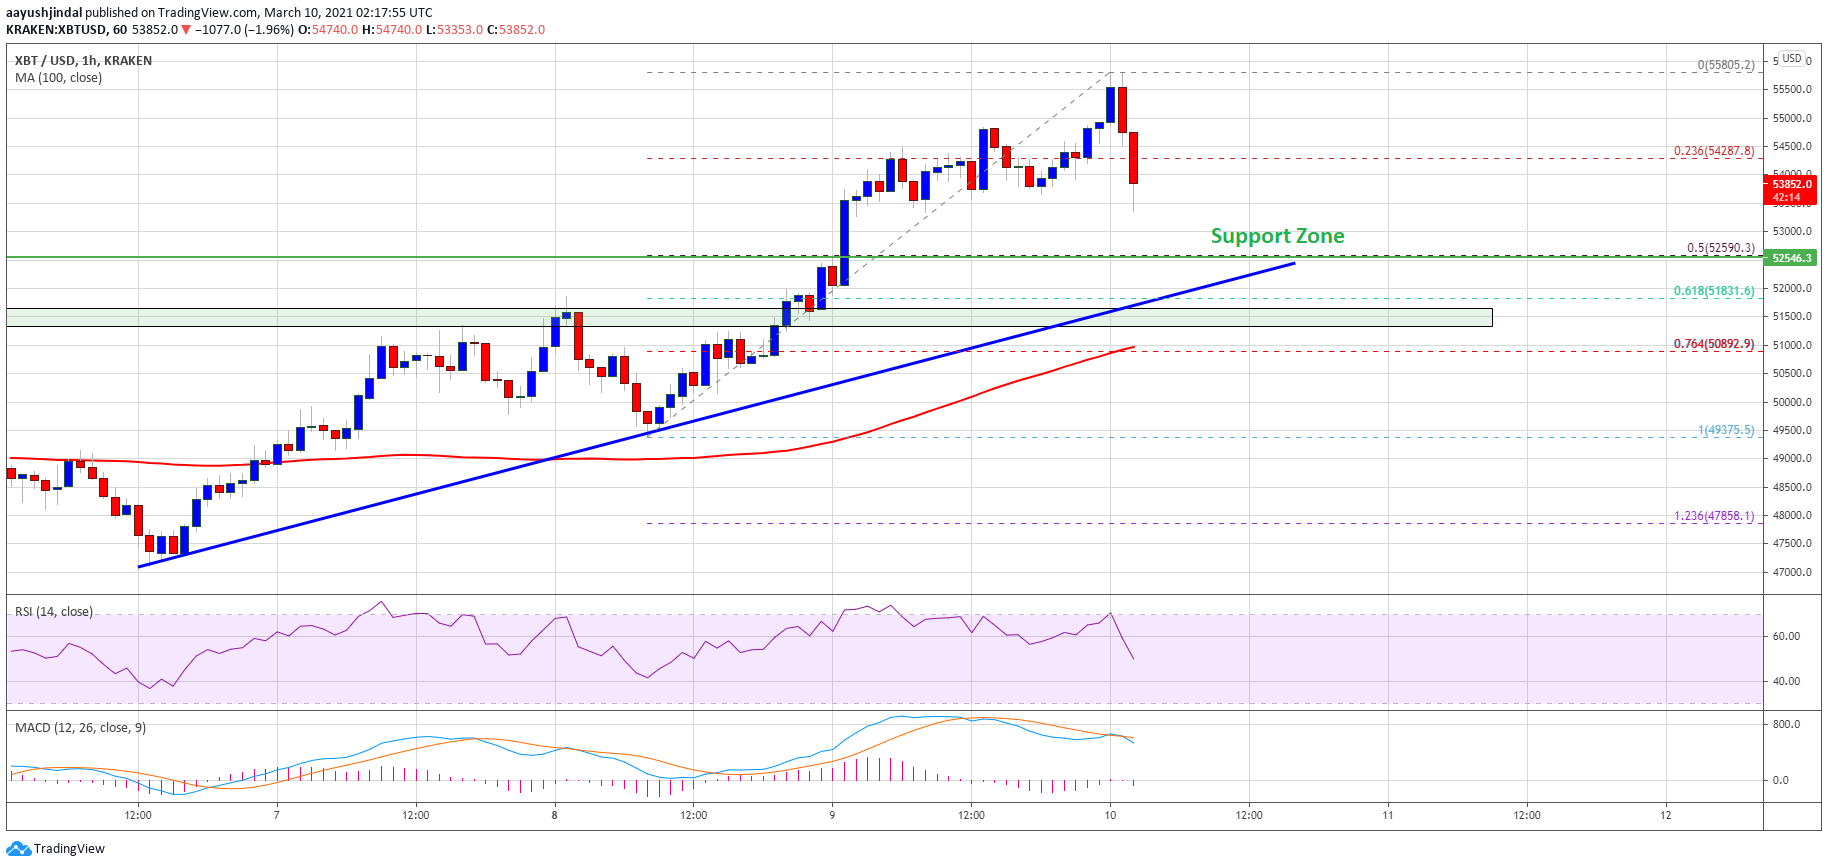
Source: BTCUSD on TradingView.com
The trend line is close to the 50% Fib retracement level of the recent increase from the $49,375 low to $55,805 high. On the upside, the $55,000 level is likely to act as a resistance again. The next key resistance is near the $55,500 level. A clear break above the $55,500 resistance could open the doors for a move above the $56,000 level.
Dips Supported in BTC?
If bitcoin continues to move down, the $52,800 and $52,500 levels are likely to hold losses. If there is a downside break below the trend line support, there are chances of a move towards the $52,000.
The next major support is near the $51,200 level. Any more downsides might call for a test of the main $50,000 support zone in the coming sessions.
Technical indicators:
Hourly MACD – The MACD is slowly losing momentum in the bullish zone.
Hourly RSI (Relative Strength Index) – The RSI for BTC/USD is now approaching the 50 level.
Major Support Levels – $53,000, followed by $52,500.
Major Resistance Levels – $54,500, $55,000 and $55,500.